Chainlink Price Prediction: LINK could dive before it retests $17
- Chainlink price seems to have stopped out at around $17 and could dive deeper.
- The digital asset could retest a crucial support level before resuming uptrend.
-637336005550289133.jpg)
Chainlink was trading inside a parallel channel until a breakout on January 3 which led the digital asset to a high of $17.39 several days later. LINK is now consolidating and could fall towards $13.
Chainlink price needs to stay above this level to retest $17
The upper trendline resistance of the parallel channel formed on the 4-hour chart should serve as a robust support level for Chainlink. LINK seems to be headed in that direction as bears have taken control of the short-term.
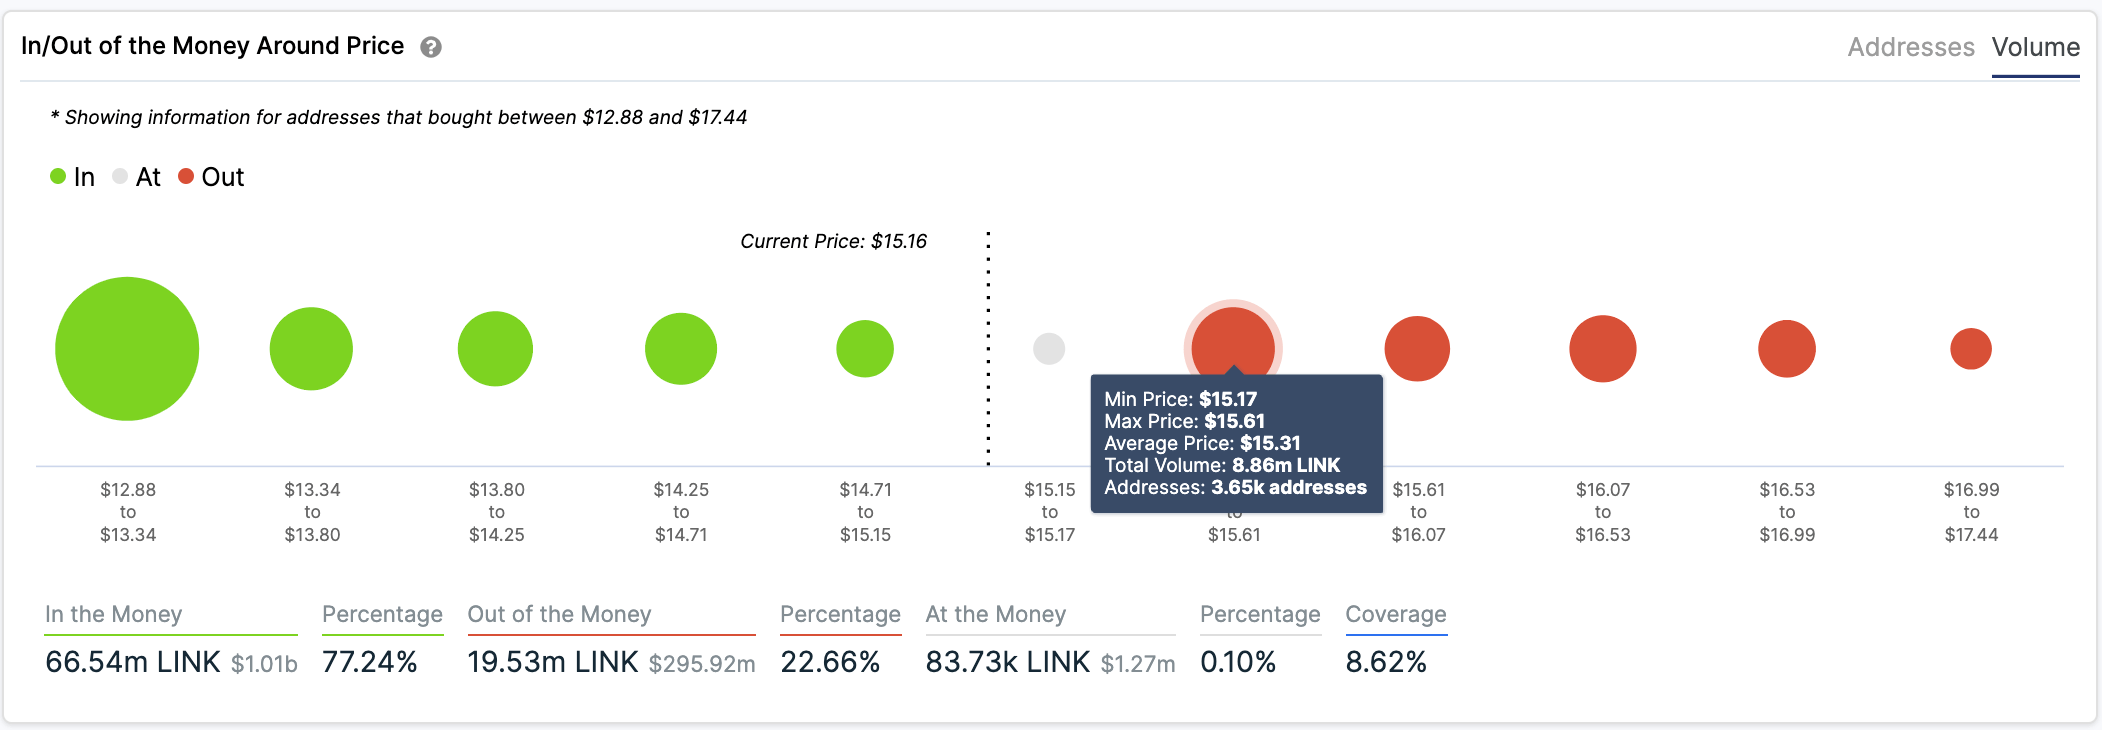
LINK IOMAP chart
The In/Out of the Money Around Price (IOMAP) chart shows very little support on the way down below $15 which also adds more credence to the bearish outlook. The most significant support area seems to be located between $12.88 and $13.34 coinciding with the upper boundary of the previous channel.
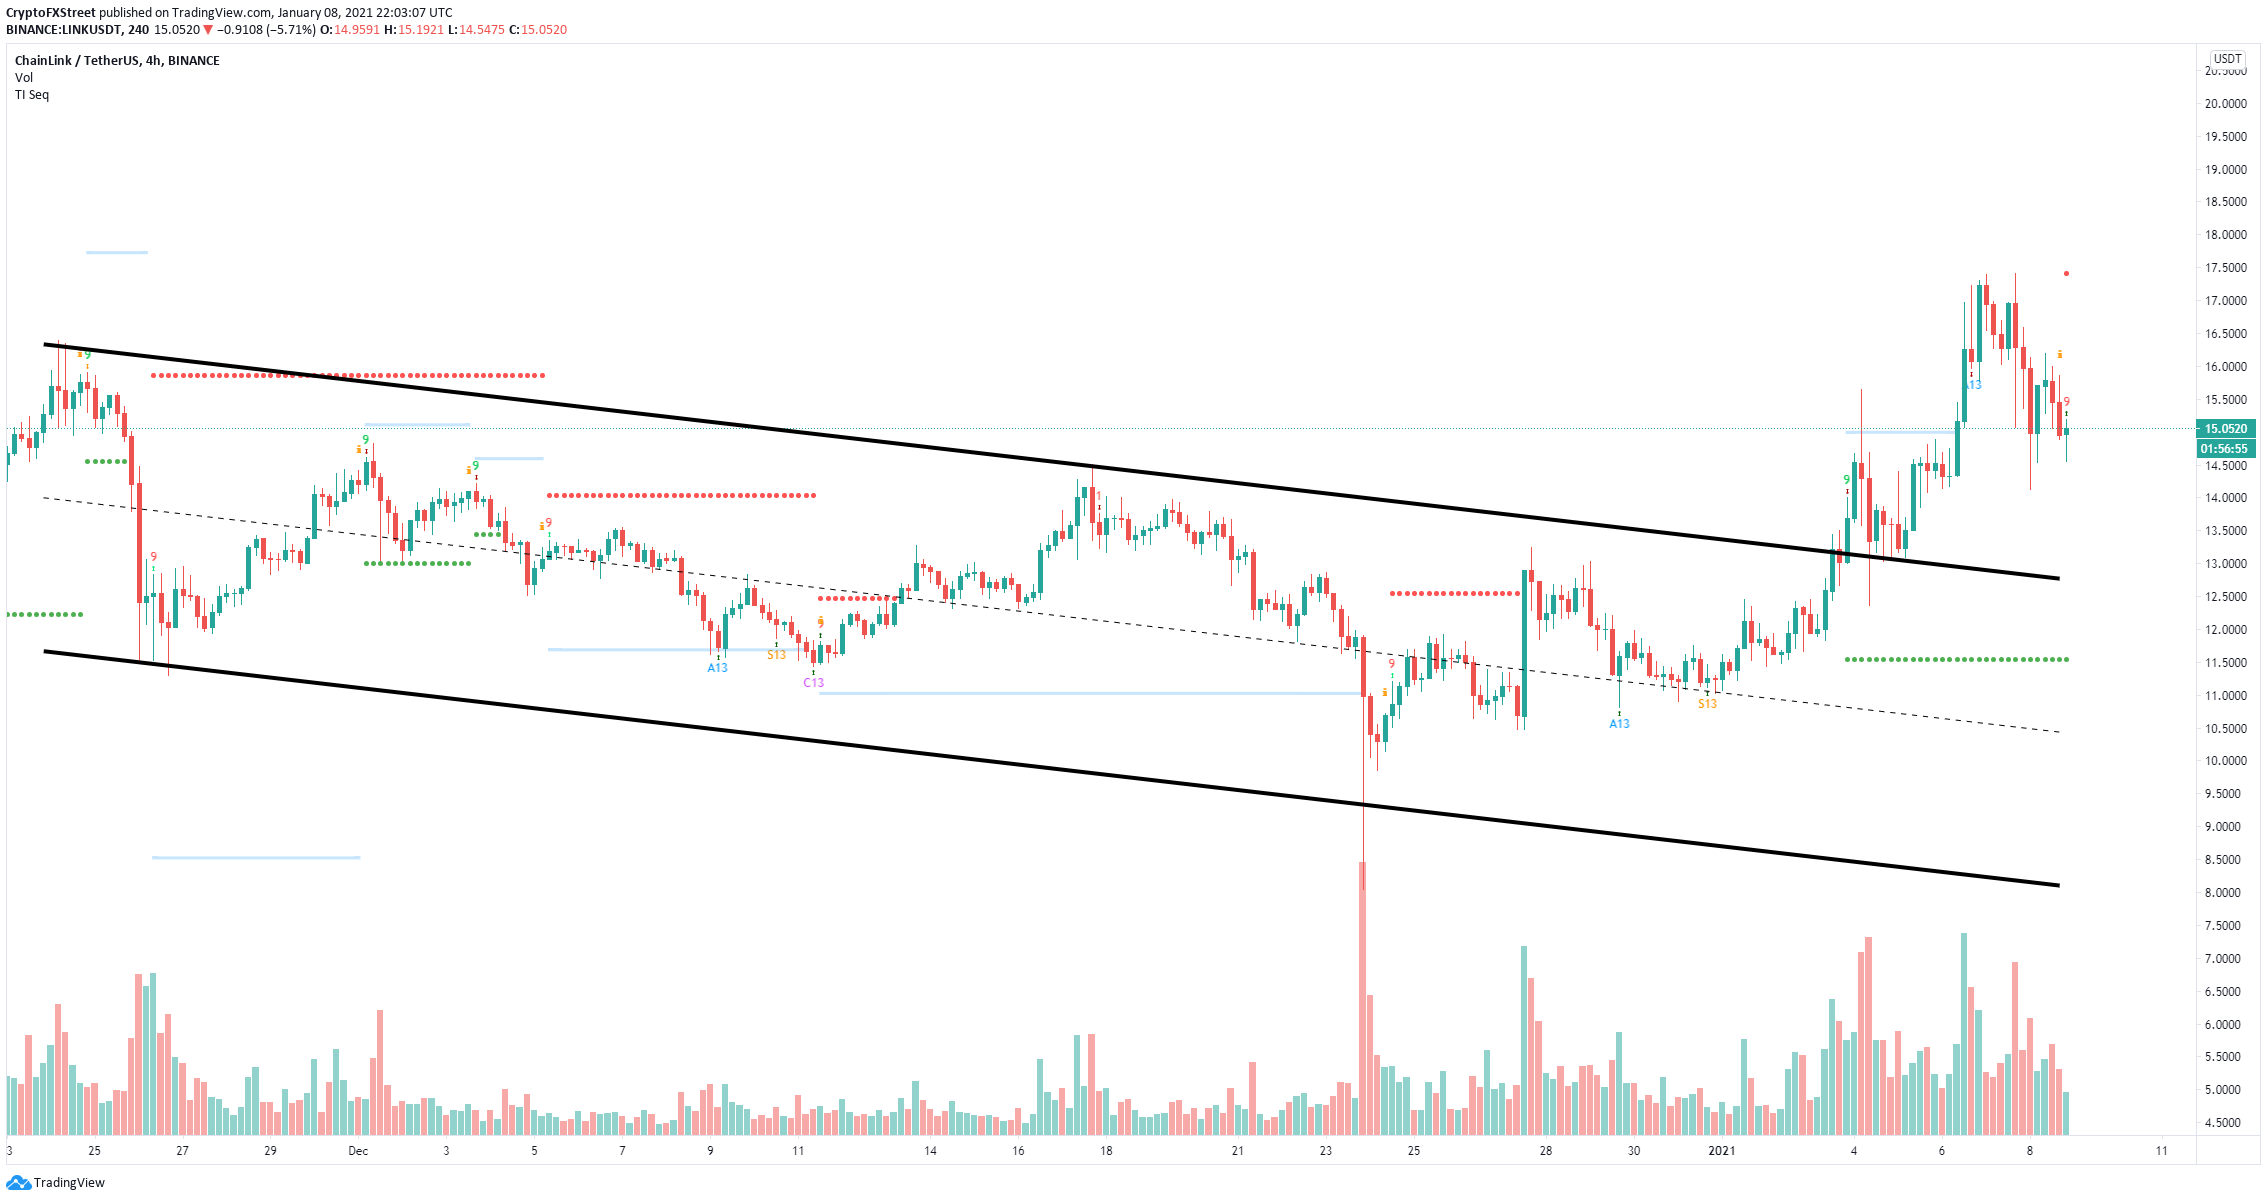
LINK/USD 4-hour chart
The TD Sequential indicator has just presented a buy signal on the 4-hour chart which adds strength to the bulls which are hoping for a rebound targeting $17 again.
The IOMAP chart also shows practically no resistance until $17.44. The most crucial resistance range is located between $15.17 and $15.61 which means that a breakout above this point can quickly push Chainlink price towards $17.44.
Author

Lorenzo Stroe
Independent Analyst
Lorenzo is an experienced Technical Analyst and Content Writer who has been working in the cryptocurrency industry since 2012. He also has a passion for trading.