Chainlink Price Prediction: LINK bulls flee as broadening wedge pattern hints at a 50% drop
- Chainlink price nears the end of an ascending broadening wedge pattern that forecasts a 50% drop.
- Transactional data shows that $17.8 could be an inflection point.
- If LINK price slices through this support, then a drop to $13 seems likely.
-637336005550289133.jpg)
Chainlink price suffered a 26% crash due to the sell-frenzy witnessed on Monday’s trading session. A continuation of this selling pressure has caused LINK to drop an additional 17% in the last five hours.
Chainlink price hangs by a thread
Chainlink price has formed a series of higher highs and higher lows since January 17. By joining the pivot highs and lows using trendlines, an ascending broadening wedge forms. This setup is a reversal pattern when it forms after a bull rally and forecasts a 50% downswing to $13.
The target is determined by adding the distance between the swing high and pivot low to the breakout point at $27.45.
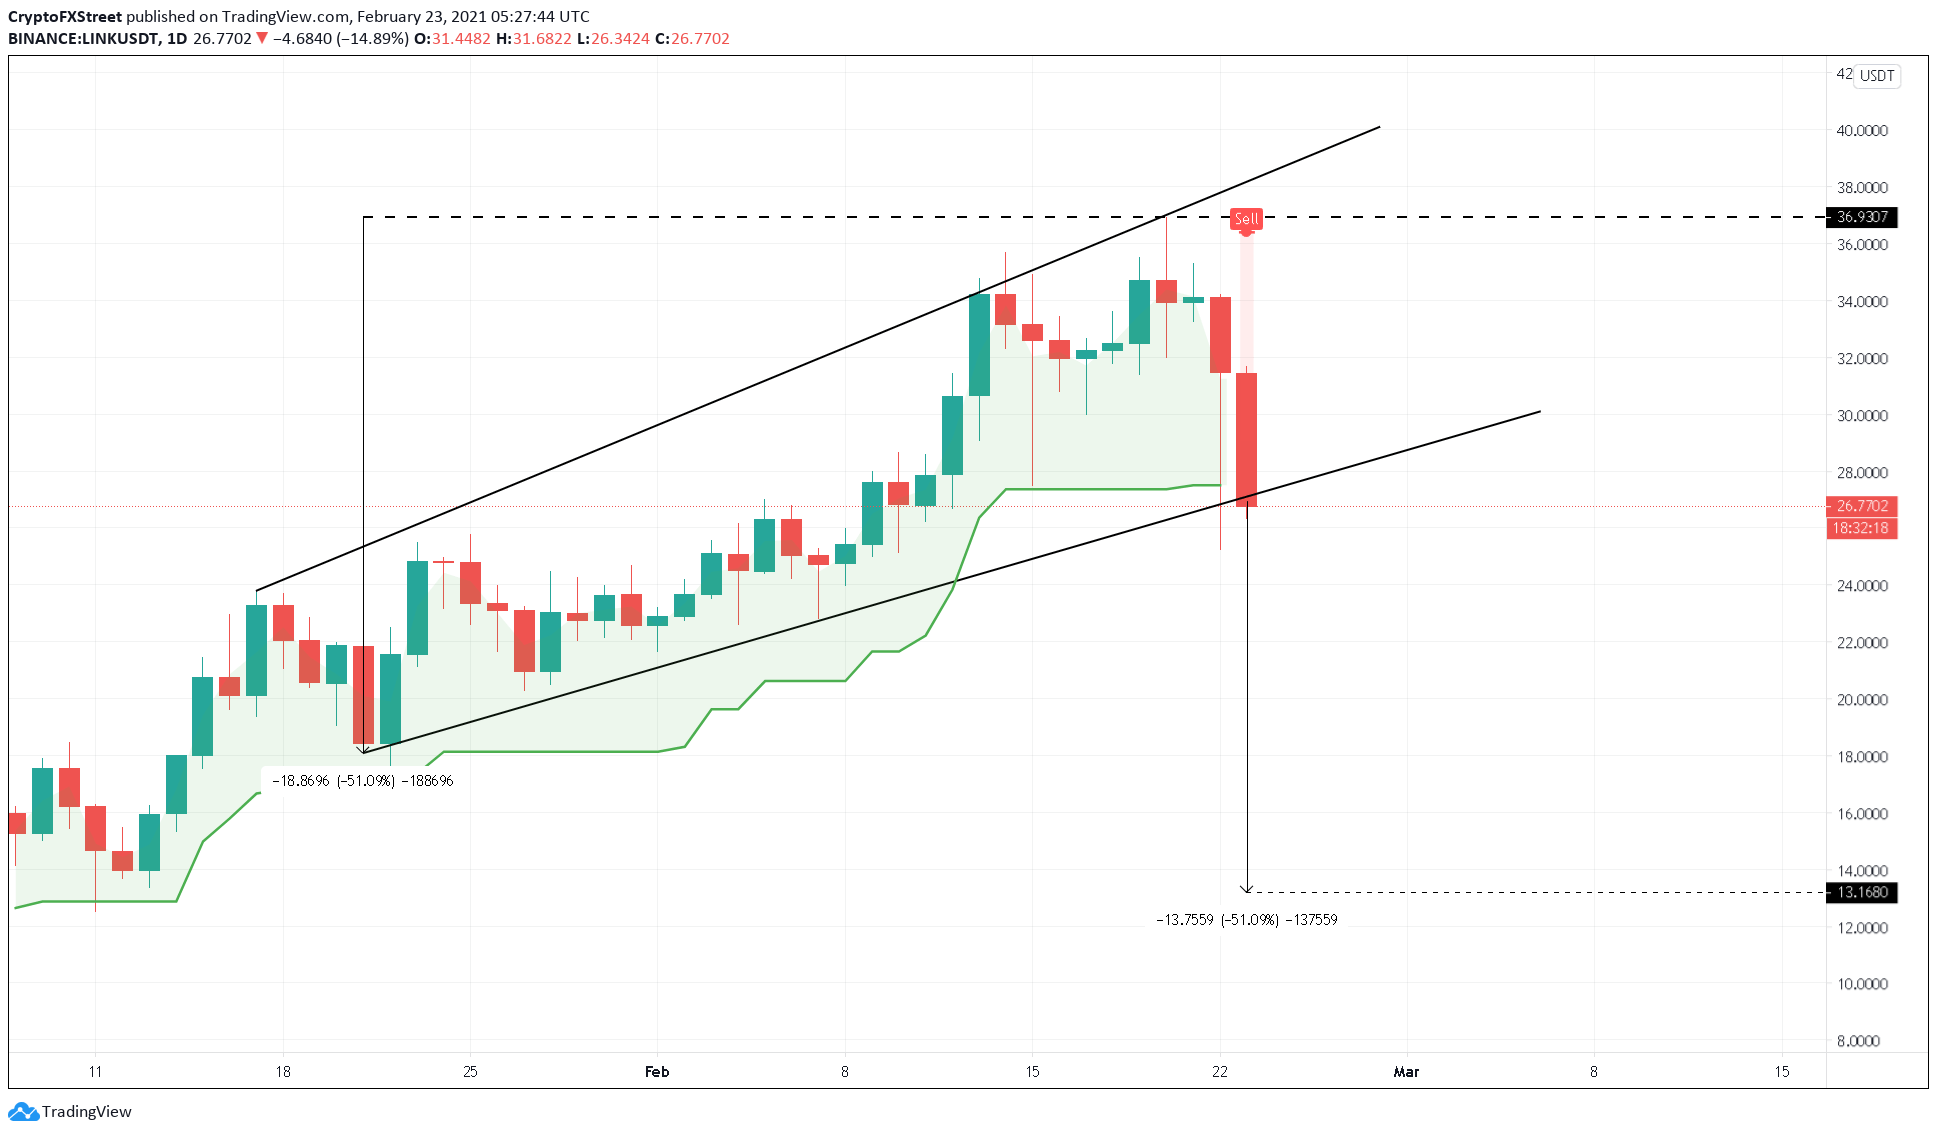
LINK/USDT 1-day chart
Supporting this bearish outlook is the SuperTrend indicator's sell-signal seen as a result of today's drop.
Based on IntoTheBlock’s Global In/Out of the Money (GIOM), roughly 28,000 addresses have purchased nearly 42 million LINK at an average price of $27.45. Therefore, a one-day candlestick close below this level would kickstart a 35% crash to $17.8. GIOM cohorts show that 41,000 addresses hold 35 million LINK here and will withstand any short-term selling pressure.
However, a sell-off similar to the one seen on Monday’s trading session could breach this support. In such a case, the oracle token will drop to the next meaningful support barrier at $13, where 45,000 addresses hold about 55 million LINK.
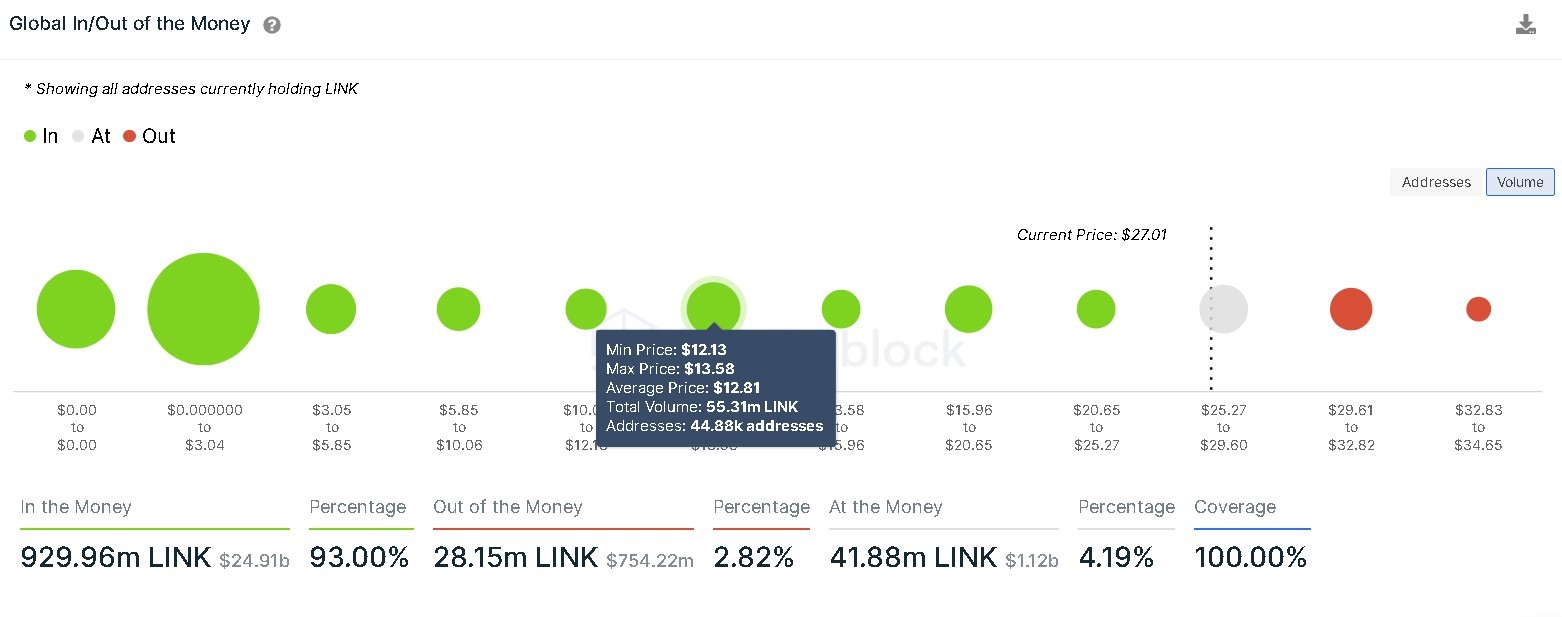
Chainlink GIOM chart
Regardless of the market’s extreme bearish momentum, investors should note that interested market participants might consider the $17.8 as a place to “buy the dip.” Hence, the resulting buying activity could not only invalidate the bearish thesis but push the price towards resistance levels at $27.45 or $23.55.
Author

Akash Girimath
FXStreet
Akash Girimath is a Mechanical Engineer interested in the chaos of the financial markets. Trying to make sense of this convoluted yet fascinating space, he switched his engineering job to become a crypto reporter and analyst.



