Chainlink price forms local bottom, targets $30 next
- Chainlink price hits support inside Ichimoku Cloud
- Oscillator values show bullish divergences and oversold conditions.
- Higher prices are expected, but some downside risks remain.
-637336005550289133.jpg)
Chainlink price has undoubtedly given back a good amount of the gains it generated from the beginning of the year. LINK rallied as much as 47% from the new year's open but has given back the great majority of those gains – Chainlink is now up 8% vs. 47%.
Chainlink price finds buyers and support structure, another drive higher now expected
Chainlink price had an easy time finding buyers as it approached the bottom of the daily Ichimoku Cloud (Senkou Span A) at $20.75. Despite dropping below the Tenkan-Sen, Kijun-Sen, and the 61.8% Fibonacci retracement, the oscillators support another push towards the $30 price level.
The Optex Bands oscillator shows a persistent and long trending move south towards the extreme oversold levels. The last time the Optex Bands were in that extreme, Chainlink rallied from $17.75 to $28.75. Likewise, the Relative Strength Index is between the two oversold levels in a bull market of 50 and 40. However, the most essential oscillator condition to observe is the Composite Index.
The Composite Index has moved into a very significant extreme. It is now the second-lowest low in Chainlink’s history on the daily chart. In addition, it is below the recent trough found on December 31, 2021, and below the trough found on December 5, 2021. In both instances, the current close and lows on the price chart are higher than the close and lows of December 5 and December 31.
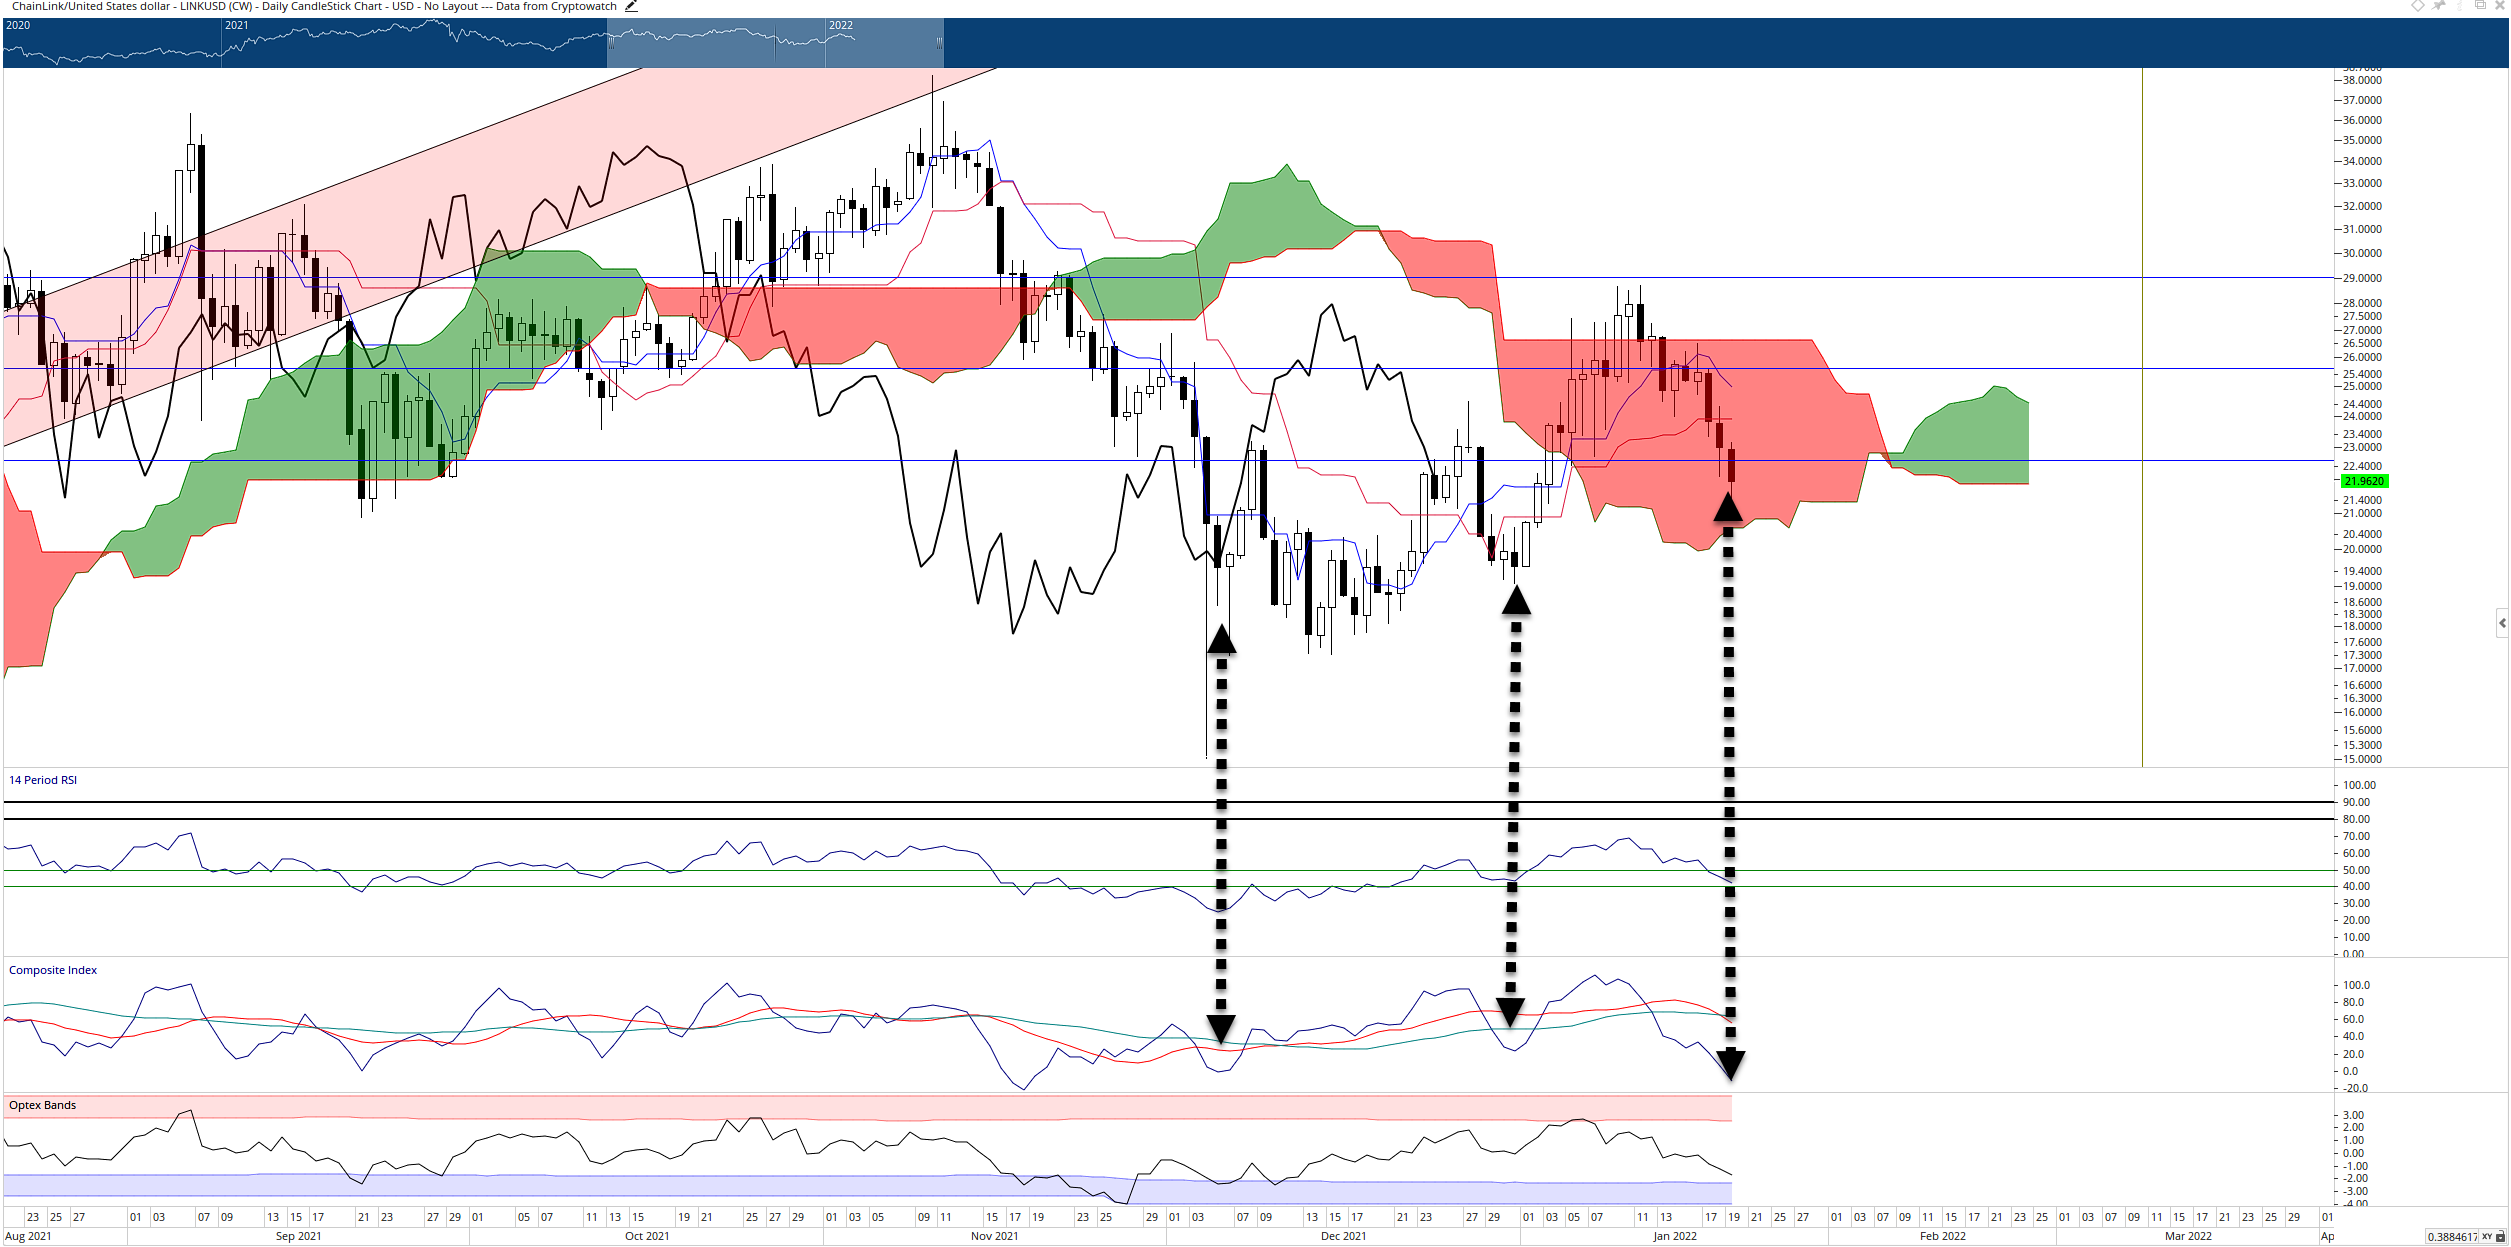
LINK/USDT Daily Ichimoku Kinko Hyo Chart
As a result, hidden bullish divergence has developed. Hidden bullish divergence occurs when an oscillator prints new lower lows, but the corresponding price action from the same period prints higher lows. It is a bullish continuation warning.
However, downside risks do remain. A daily close below $19.50 would position Chainlink price below the Cloud and the Chikou Span below the candlestick bodies and in open space, triggering an Ideal Bearish Ichimoku Breakout. A retest of $17 and lower would then be likely.
Author

Jonathan Morgan
Independent Analyst
Jonathan has been working as an Independent future, forex, and cryptocurrency trader and analyst for 8 years. He also has been writing for the past 5 years.


