Chainlink Price Forecast: On-chain, derivatives data flash downside risk
- Chainlink risks an early downcycle onset in a symmetrical triangle pattern on the daily chart.
- Derivatives data suggest traders are either deleveraging or reducing exposure.
- On-chain data indicate that large wallet investors are continuing their selling spree.

Chainlink (LINK) price is down by 2% at the time of writing on Friday, inching closer to its 50-day Exponential Moving Average (EMA) at $22.15. The on-chain and derivatives data flash the risk of potential downside extension as the interest of traders and large wallet investors, commonly referred to as whales, declines. Meanwhile, the technical outlook highlights a key support band that could extend the LINK price movement within a symmetrical triangle pattern.
Large wallet investors are fueling the headwinds
Chainlink remains under pressure as the interest of large wallet investors is declining. The on-chain data reveals that the LINK whales are booking profits, according to Santiment’s Network Realized Profit/Loss and the transaction count of over $1 million in trade volume, which displays multiple profit-taking spikes over the last two months, with many of them aligning with whales' trading activity.
A recent surge in profit-booking of 84.98 million LINK tokens on Monday aligned with 102 whale-level transactions, indicating that whales are adding to supply pressure.
The profit-taking spree by large wallet investors began with the rise in the percentage of supply in profit due to July’s rally. As of Friday, 88% of the supply is in profit, up from 84.75% on Monday, indicating that the selling pressure has reduced significantly after the sell-off at the start of the week.
 [13-1759481058763-1759481058763.44.13, 03 Oct, 2025].png)
Chainlink on-chain data. Source: Santiment
Traders reduce leveraged positions
Chainlink’s retail demand is also at risk as the short-term decline dwindles the sentiment of derivatives traders. CoinGlass data indicates that the LINK Open Interest (OI) has decreased by over 3% in the last 24 hours, reaching $1.32 billion.
Open Interest refers to the total value of all the active derivative contracts. A decline in OI indicates that traders are closing positions, projecting a risk-off sentiment.
Meanwhile, the OI-weighted funding rate of LINK remains at elevated levels above 0.0101%. Typically, bulls pay high rates to hold long positions, suggesting that demand persists in the Chainlink derivatives market.
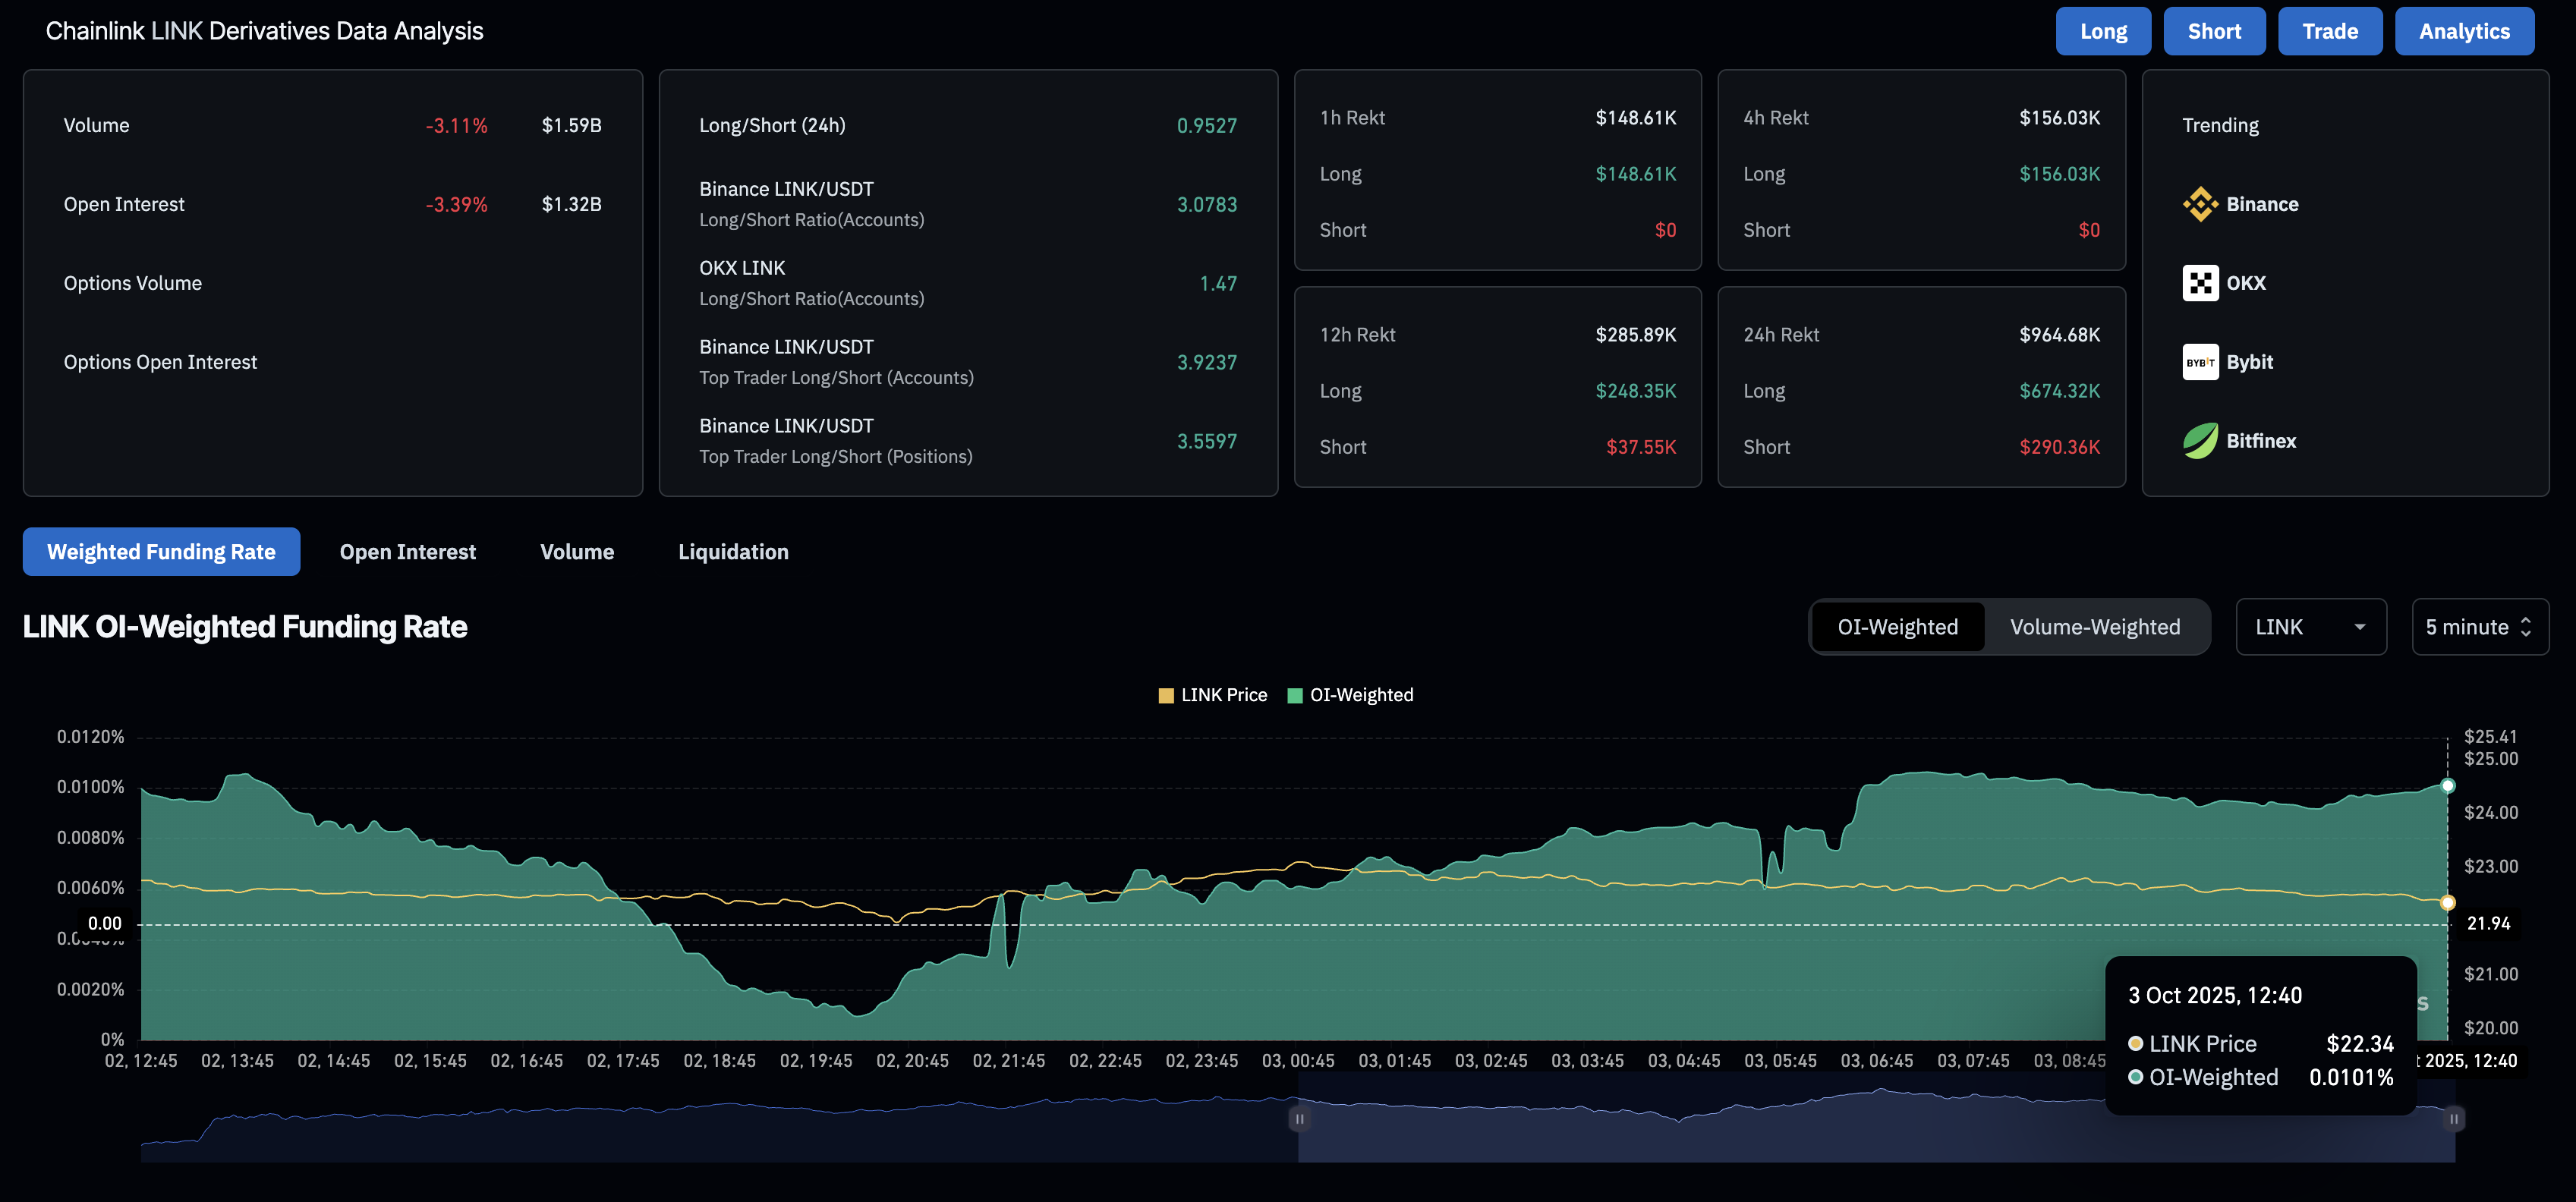
LINK derivatives data. Source: CoinGlass
Overall, the combination of declining OI with elevated funding rates suggests that traders are either deleveraging or reducing their long positions while the bullish sentiment remains. Such a dynamic could prolong consolidation or a pullback in LINK prices.
Chainlink puts additional pressure on its 50-day EMA
Chainlink edges lower by 2% at press time on Friday, approaching its 50-day EMA at $22.15 after two consecutive days of profits. This risks an early onset of a downcycle within a larger symmetrical triangle pattern formed on the daily chart.
A decisive push below the 50-day EMA could result in a retest of the triangle’s support trendline near the 100-day EMA at $20.68.
The momentum indicators flash mixed signals on the daily chart, as the Relative Strength Index (RSI) at 49 remains neutral but is forming a downward slope, which, if extended further, would indicate a decline in buying pressure.
Meanwhile, the Moving Average Convergence Divergence (MACD) stays flat above its signal line following a crossover on Thursday, indicating a lack of spark in bullish momentum to drive the uptrend.
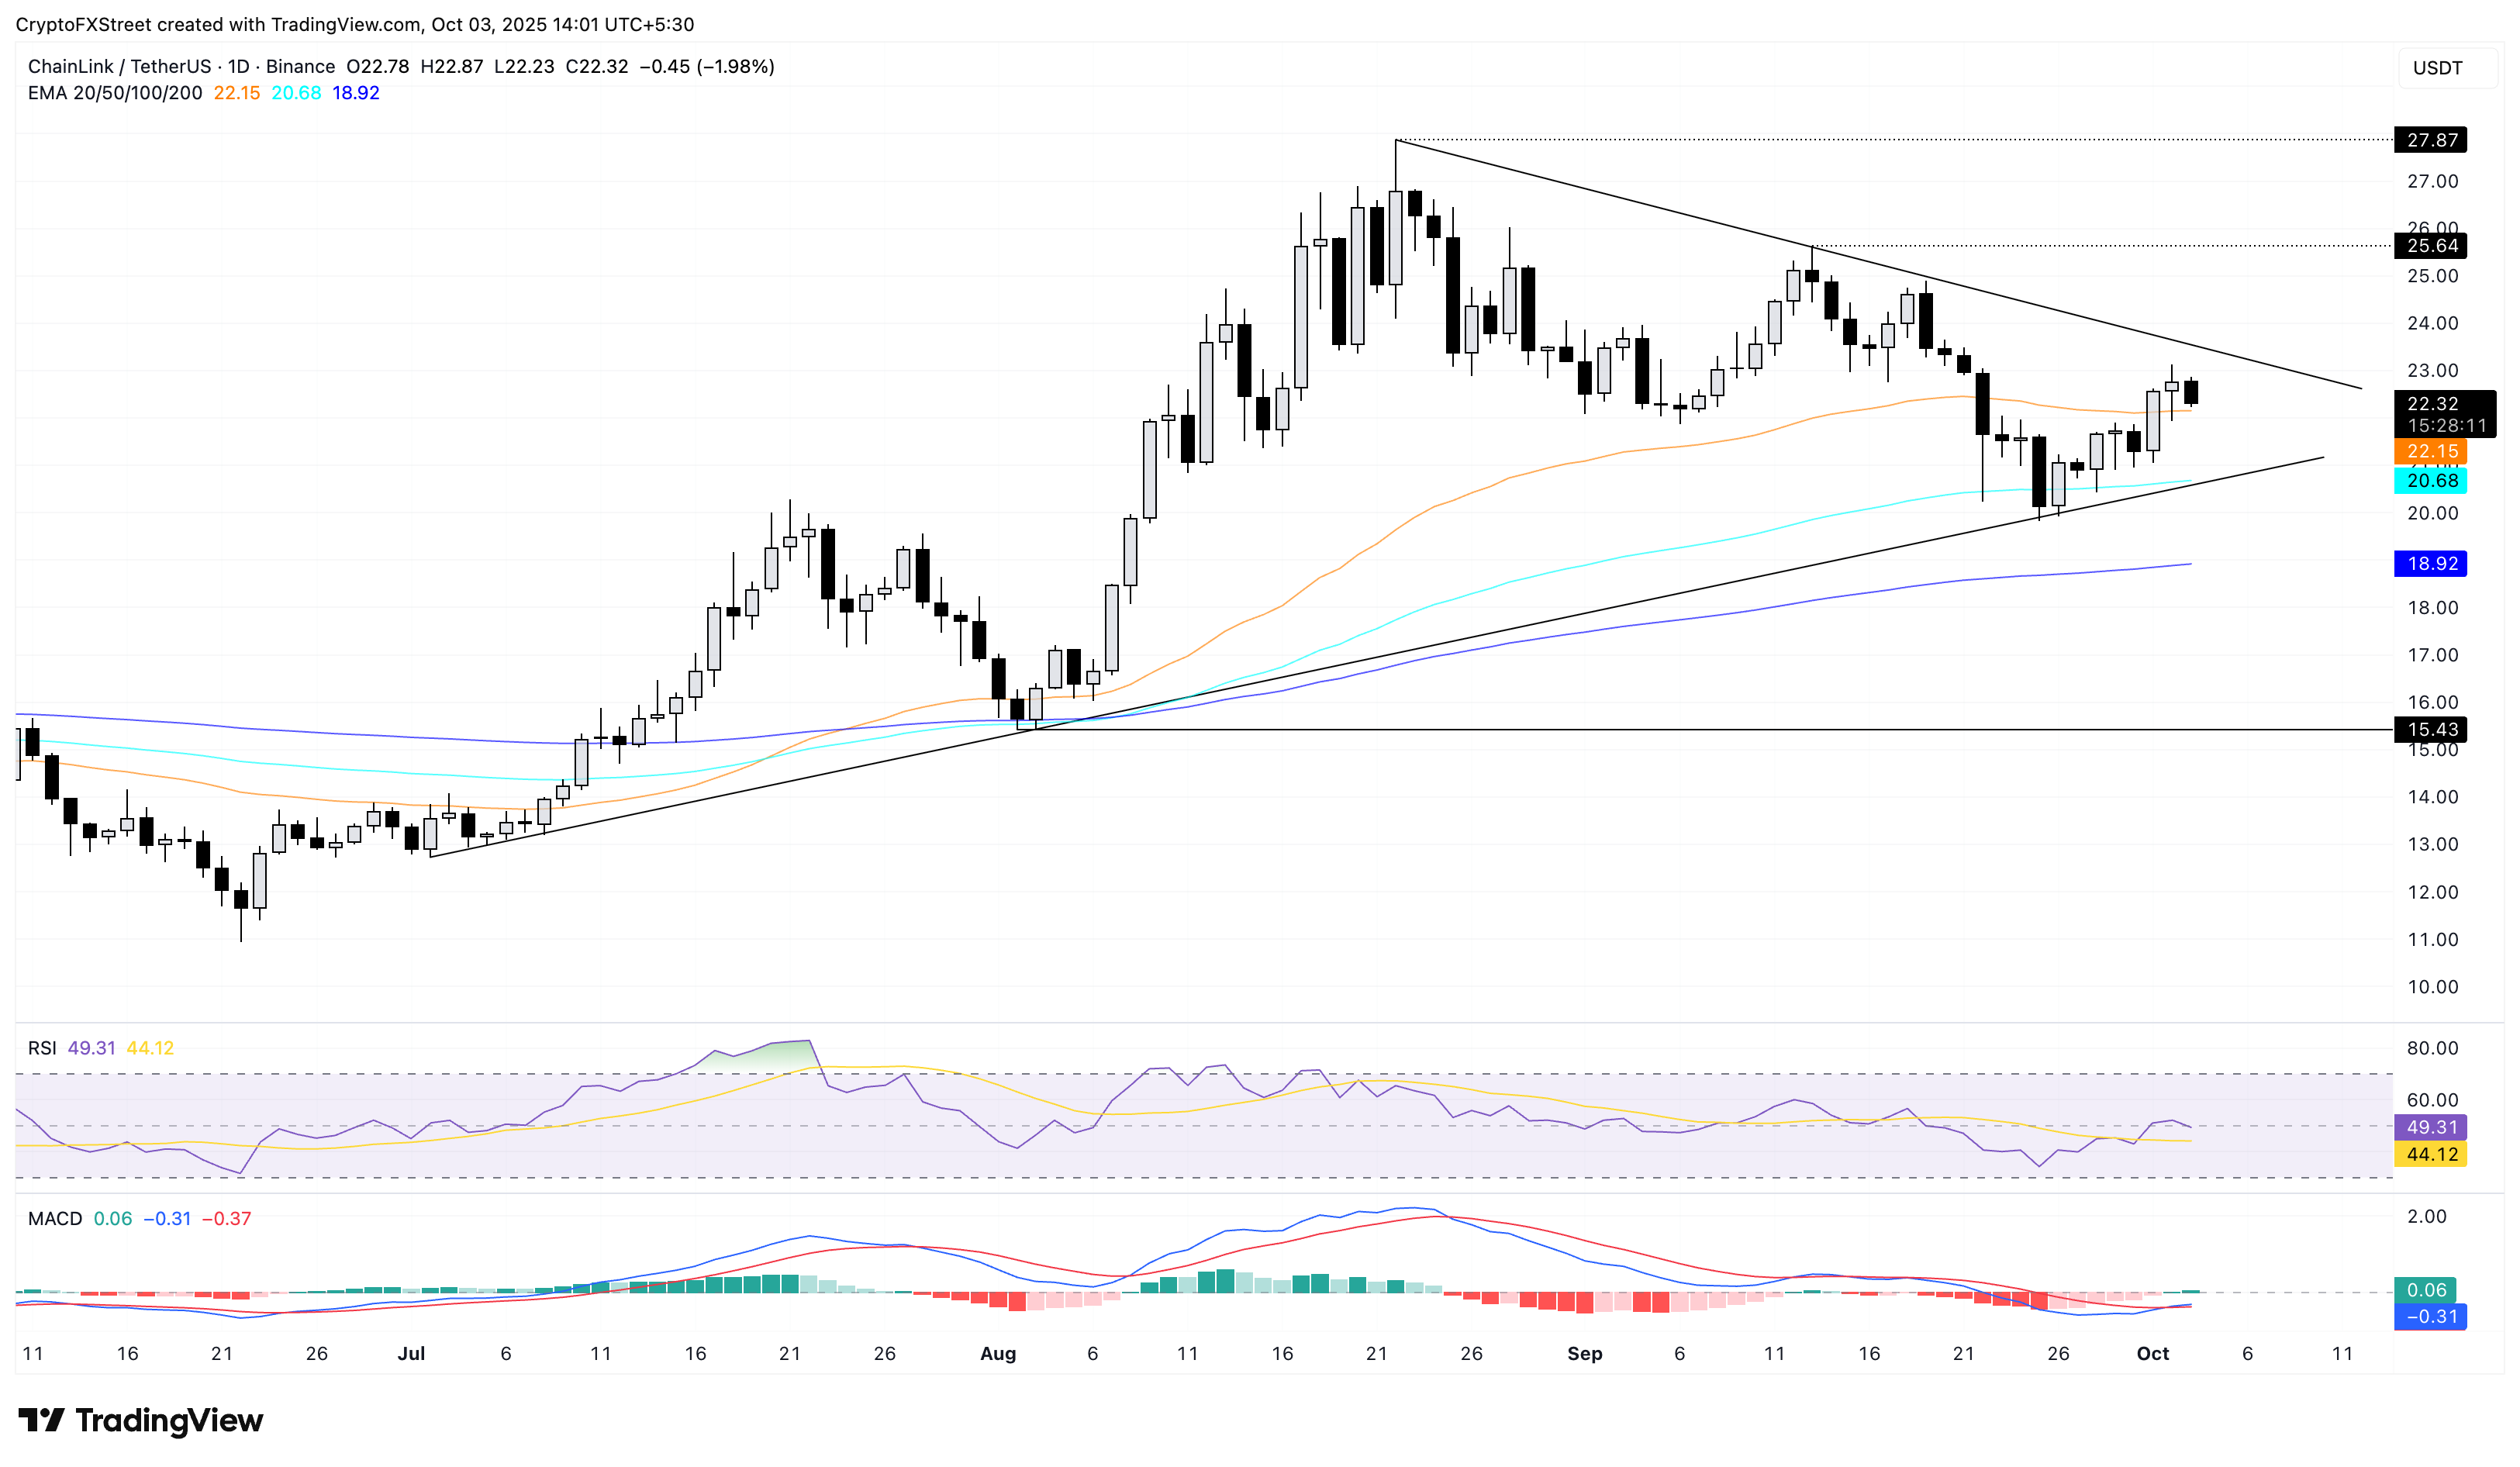
LINK/USDT daily price chart.
If LINK bounces off its 50-day EMA, it could test the triangle’s resistance trendline at $23.65, while a potential breakout rally might face opposition at $25.64, the peak of September 13.
Author

Vishal Dixit
FXStreet
Vishal Dixit holds a B.Sc. in Chemistry from Wilson College but found his true calling in the world of crypto.


