Chainlink Price Forecast: LINK holders bought into recent price dips
- Chainlink price retests and finds support around its descending trendline at $16.91, while eyeing a recovery ahead.
- On-chain data paints a bullish picture as LINK’s daily active addresses and revenue generated are rising.
- Supply Distribution data shows that two cohorts of whales bought LINK during the recent price dip.

Chainlink (LINK) price is retesting and finding support around its descending trendline throwback at $16.91 this week, eyeing a recovery ahead. On-chain data supports the recovery as LINK’s daily active addresses and revenue generated are rising. Moreover, LINK’s Supply Distribution data shows that two cohorts of whales bought LINK during the recent price dip, hinting at a recovery ahead.
LINK holders bought the dips
Santiment’s Supply Distribution metric shows that the whales holding LINK tokens between 1 million and 10 million dropped from 195 million on Saturday to 190.72 million on Wednesday. Meanwhile, wallets holding 100,000 to 1 million and 10 million to 100 million surged from 155.31 million to 159.53 million and 479 million to 480.78 million, respectively, in the same period.
This development shows that the first cohort of whales could have fallen prey to the capitulation event. In contrast, the second set of wallets seized the opportunity and accumulated Chainlink at a discount during the recent price dip, bolstering investors’ confidence in LINK.
%20[10.22.51,%2005%20Feb,%202025]-638743323544918120.png)
Chainlink supply distribution chart. Source: Santiment
Another aspect bolstering the platform’s bullish outlook is a recent surge in Chainlink blockchain usage. Token terminal data shows that LINK’s daily active addresses rose from 2,900 on Saturday to 6,300 on Monday, the highest level since December 13.
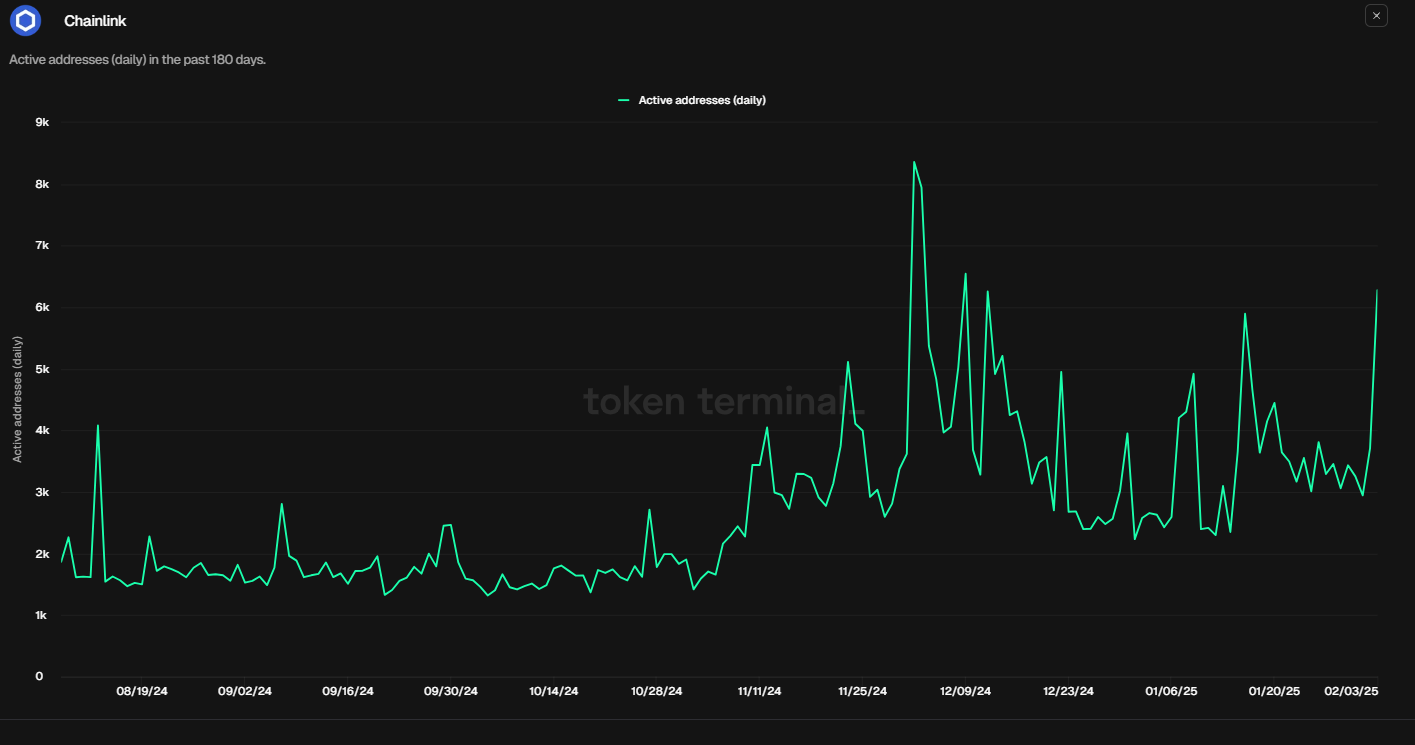
LINK active addresses chart. Source: Token Terminal
Additionally, Token Terminal data shows that LINK generated $4.5k in revenue on Monday, the highest daily revenue collected since December 21, further bolstering the bullish outlook.
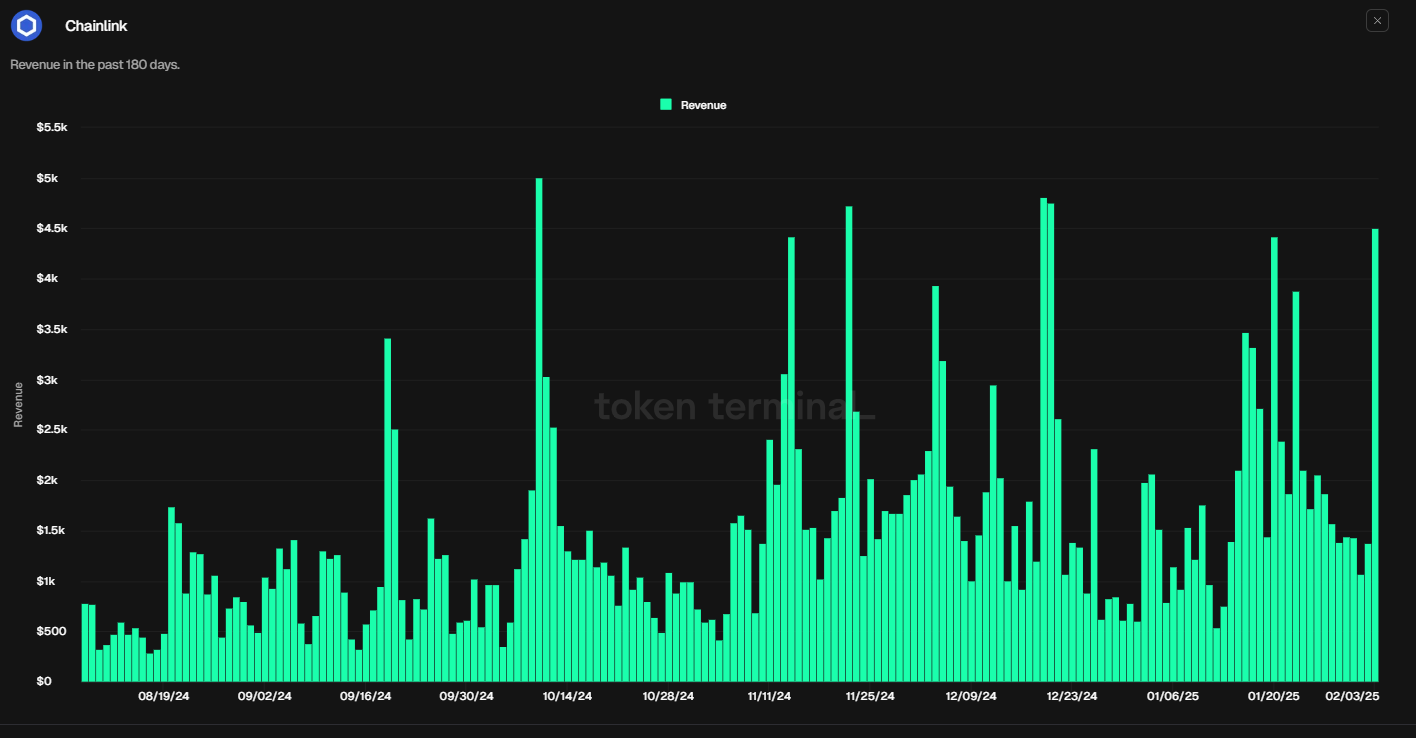
Chainlink Revenue chart. Source: Token Terminal
Chainlink Price Forecast: LINK retests its descending trendline throwback support
Chainlink price declined more than 17% in the previous week. At the start of this week, it retested, found support around its descending trendline (drawn by joining multiple highs since early November 2021) throwback, and is trading around $19.88 on Wednesday. This descending trendline roughly coincides with the 50-day Exponential Moving Average (EMA) at $18.88, making this level a key reversal zone.
If the descending trendline supports, LINK will extend the rally toward its December 13 high of $31.20.
The weekly chart's Relative Strength Index (RSI) reads 52, above its neutral level, indicating bullish momentum. However, the Moving Average Convergence Divergence (MACD) indicator is about to trigger a bearish crossover on the weekly chart. Traders should be cautious as a bearish crossover suggests a downward trend.
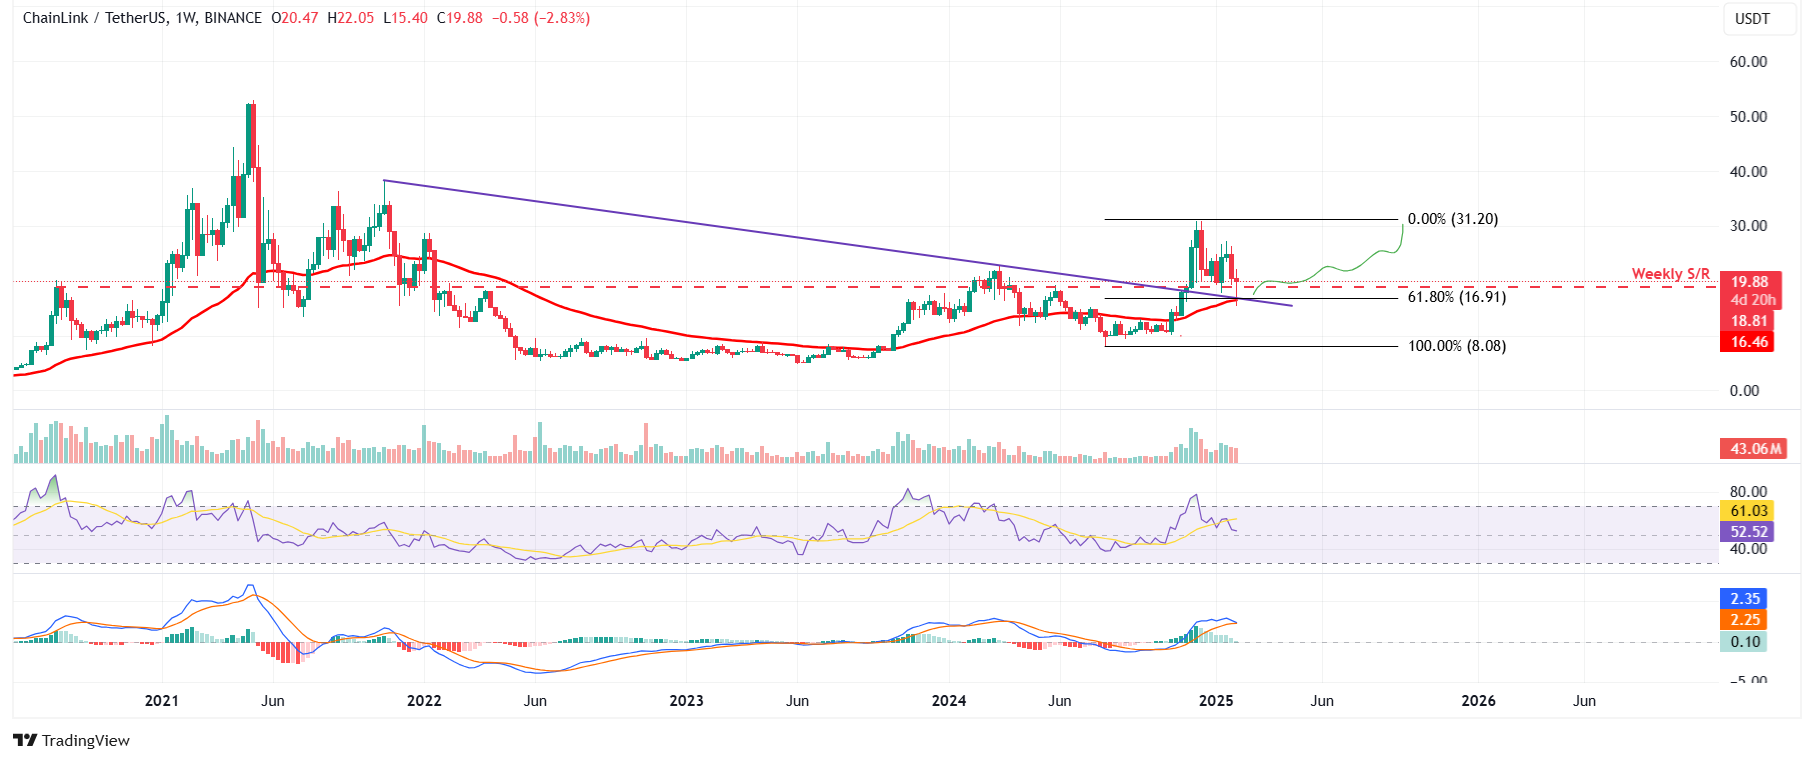
LINK/USDT weekly chart
Author

Manish Chhetri
FXStreet
Manish Chhetri is a crypto specialist with over four years of experience in the cryptocurrency industry.