Chainlink Elliott Wave technical analysis [Video]
![Chainlink Elliott Wave technical analysis [Video]](https://editorial.fxsstatic.com/images/i/CHAINLINK.png)
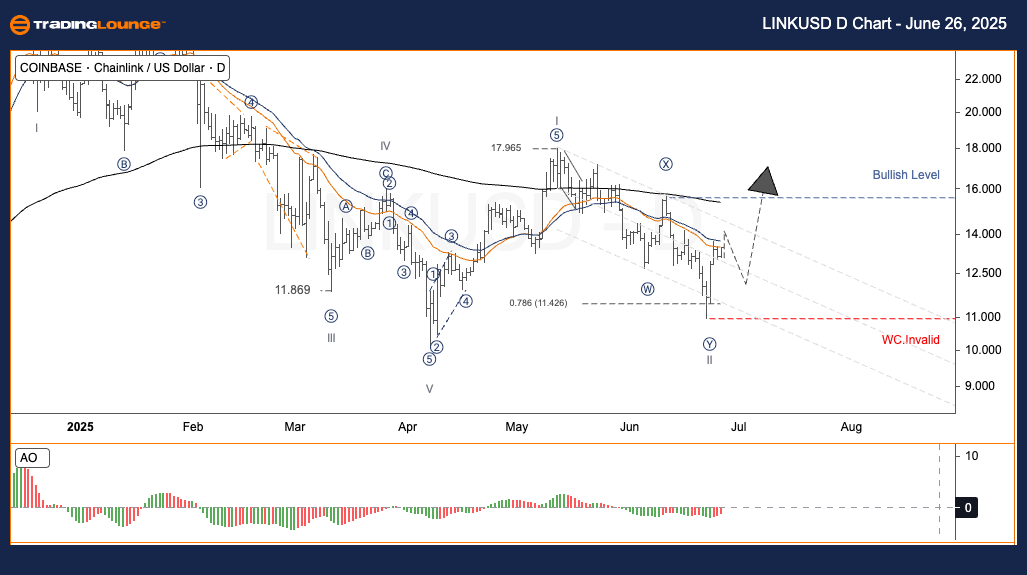
LINK/USD Elliott Wave technical analysis – Daily chart
-
Function: Counter Trend.
-
Mode: Corrective.
-
Structure: Double Corrective.
-
Position: Wave 2.
-
Invalidation level: Not defined.
Chainlink trading strategy
In the previous wave I, the price formed an Expanded Diagonal pattern, peaking at $17.97. The retracement wave II formed a Double Zigzag structure, touching the 0.786 Fibonacci retracement level at $11.43.
Now, the price is bouncing back in wave (1) and may currently be in a retracement phase with wave (2) before entering an uptrend in wave (3).
The critical resistance lies around $16.00, which serves as the Bullish Confirmation Level. A break above this level could validate a mid-term upward movement.
Trading strategy highlights
Swing Trading (Short-term):
- Wait for the completion of the wave (2) consolidation.
- Look to enter during wave (3), which could have increased momentum.
Risk management:
- Watch the Invalidation Level near $10.80 to manage downside risk.
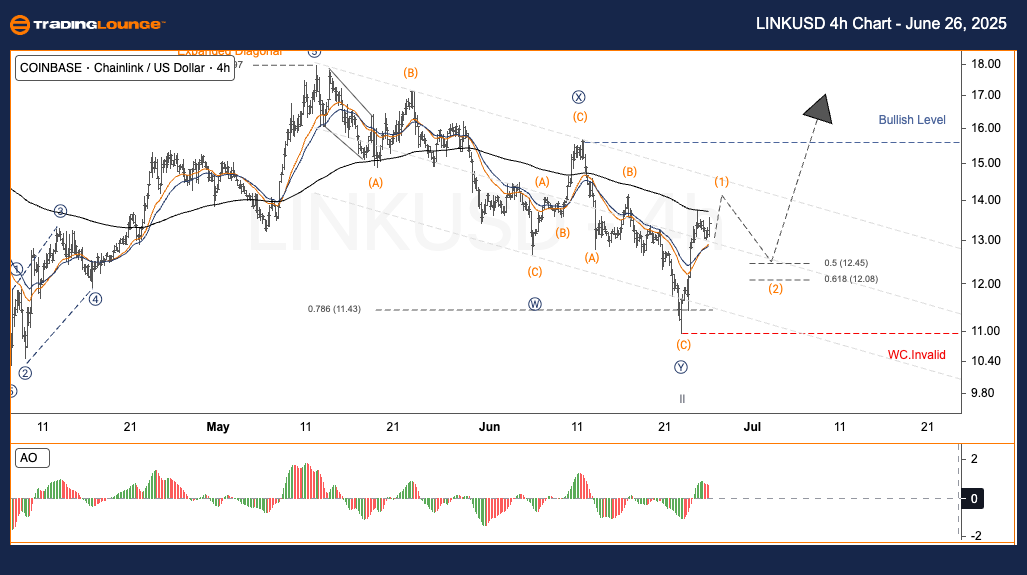
LINK/USD Elliott Wave technical analysis – Four-hour chart
-
Function: Counter Trend.
-
Mode: Corrective.
-
Structure: Double Corrective.
-
Position: Wave 2.
-
Invalidation level: Not defined.
Overview
Same as the Daily Chart – wave I topped at $17.97, wave II ended at $11.43 after a Double Zigzag correction.
Current price movement appears to be wave (1) moving upward, with a potential short-term pullback in wave (2).
Key resistance remains $16.00 – a decisive breakout here would reinforce bullish structure heading into wave (3).
Swing trade strategy
- Await the end of wave (2) retracement before entering into wave (3).
Invalidation zone: Near $10.80
Chainlink Elliott Wave technical analysis [Video]
Author

Peter Mathers
TradingLounge
Peter Mathers started actively trading in 1982. He began his career at Hoei and Shoin, a Japanese futures trading company.


