Cardano Technical Analysis: ADA/USD trends horizontally above $0.09
- Since July 29, ADA/USD has dropped from $0.149 to $0.09103.
- ADA/USD holders have transferred their coins to different wallets to increase their chances of rewards.

ADA/USD daily chart
-637352150581440452.png)
ADA/USD fell from $0.1242 to $0.09 over the last seven days. The RSI is trending alongside the over oversold zone, showing that the price can drop even more. The next healthy support level of note is at $0.08556. Since July 29, ADA/USD has fallen from $0.149 to $0.09103.
ADA/USD 12-hour chart
 (1)-637352150871145785.png)
In the 12-hour chart, ADA/USD is falling in a downward channel formation. The price found support at the $0.0856 line and then somewhat bounced up to its current levels. It will be highly unlikely for the bulls to reverse this trend any time soon.
ADA/USD 4-hour chart
 (2)-637352151159757720.png)
In the 4-hour chart, ADA/USD is stifled under the SMA 20 curve. The buyers will need to take the price up to $0.09132 to pass this resistance level. However, the MACD shows decreasing bullish momentum.
ADA/USD hourly chart
 (3)-637352151450090553.png)
The hourly ADA/USD price has been trending between $0.0895 (support) and $0.009143 (resistance). Sandwiched between these two levels, the price has little potential for growth.
Cardano on-chain analysis
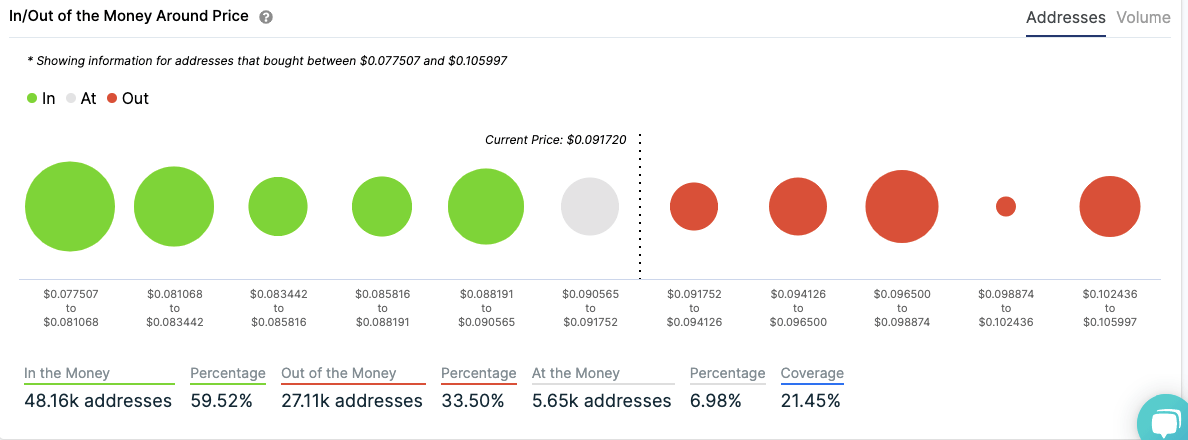
The in/out money for ADA shows that the buyers can gain enough momentum to go up to $0.0965 before it encounters the first resistance level of note. On the downside, the price can go down to $0.090565 where it has a healthy support level.
ADA holder behavior
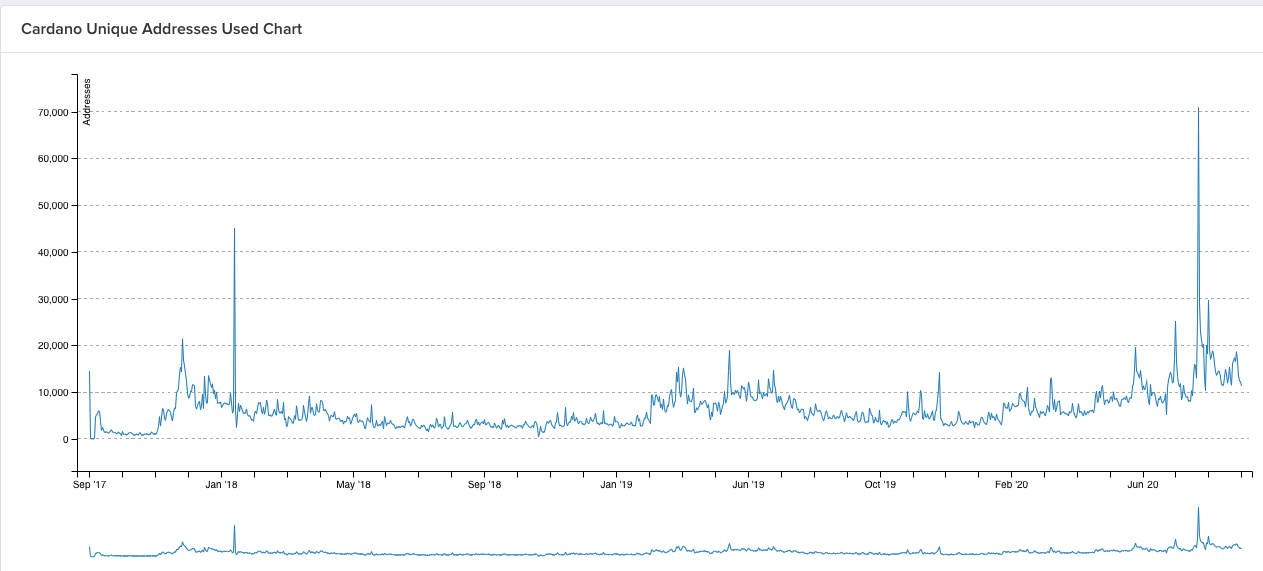
The screenshot above shows you the number of unique addresses in the Cardano ecosystem. We can see that there was a spike to 70,000 on July 30 before it dipped all the way down to 11,300.
So, what happened here?
According to Reddit, it looks like the existing holders are creating more wallet addresses to distribute their Cardano holdings and participate in more staking pools. This increases their chances of receiving more rewards.
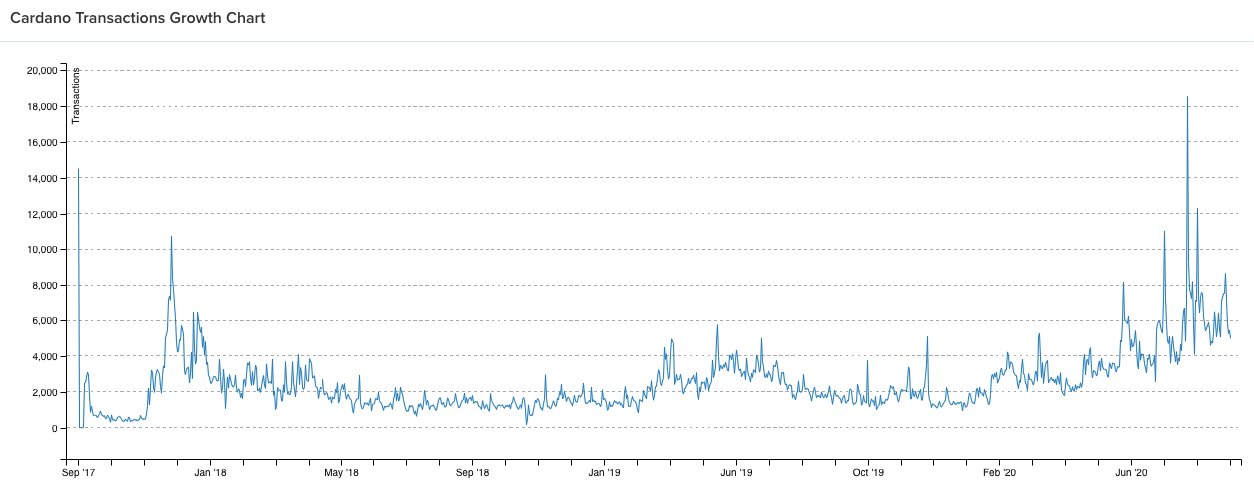
When you look at the transaction growth chart, it corroborates this theory as it is almost similar to the unique addresses chart. The holders are simply transferring their coins and staking them in the ecosystem through different wallets.
Author

Rajarshi Mitra
Independent Analyst
Rajarshi entered the blockchain space in 2016. He is a blockchain researcher who has worked for Blockgeeks and has done research work for several ICOs. He gets regularly invited to give talks on the blockchain technology and cryptocurrencies.


