Cardano price locked in downtrend as ADA buyers are nowhere to be found
- Cardano price could continue to trend lower as the token is sealed within a consolidation pattern.
- A technical indicator suggests that there is a significant increase in ADA sellers.
- Cardano is at risk of a 36% decline if the Ethereum killer falls below $1.00.

Cardano price could continue its downtrend within the prevailing chart pattern as the bears engage in a sell-off. A technical indicator has flashed a local top signal, also suggesting that the momentum has flipped to the downside.
Cardano price prints consolidation pattern
Cardano price has formed a descending parallel channel on the daily chart, as ADA has consistently recorded lower highs and lower lows.
The Arms Index (TRIN), which gauges overall market sentiment suggests that there is a significant uptick in sellers than buyers, indicating a sell-off.
The Momentum Reversal Indicator (MRI) has flashed a local top signal on the January 20 candle, adding credence to the bearish narrative.
The first line of defense for Cardano price is at the June 23 low at $1.10. If selling pressure continues to increase, ADA may test the lower boundary of the governing technical pattern at $1.00 as a level of support.
Investors should note that if Cardano price drops below the aforementioned foothold, a 36% decline toward $0.64 would be put on the radar, a bearish target given by the prevailing chart pattern.
ADA will discover two support levels at the February 22 low at $0.81, then at the February 8 high at $0.72 before Cardano price falls toward the bearish target at $0.64.
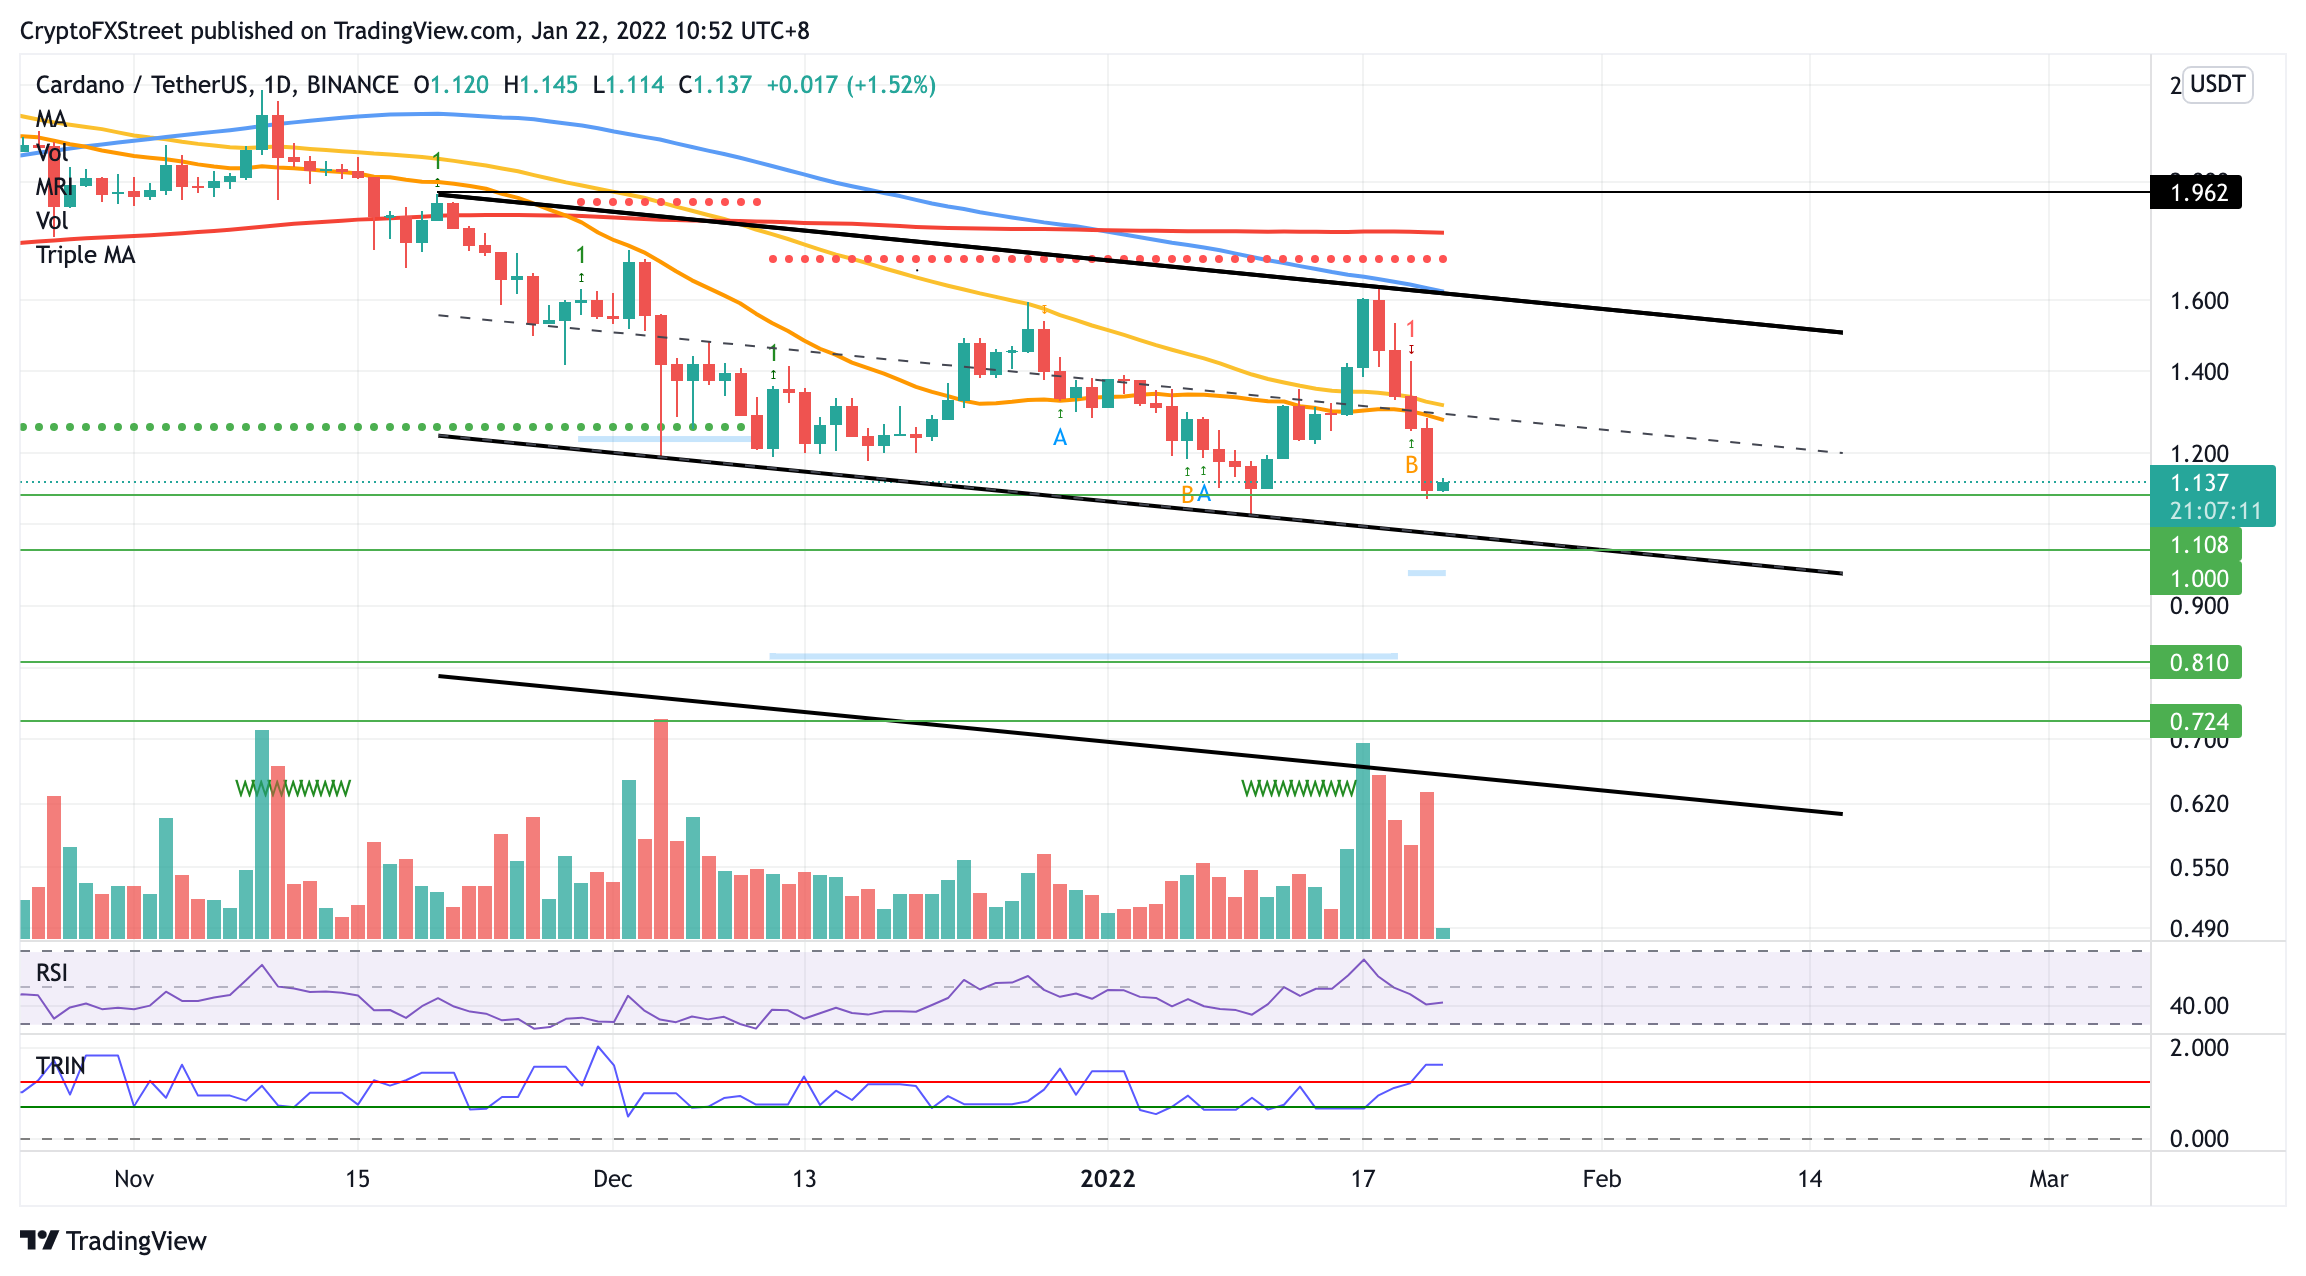
ADA/USDT daily chart
However, if the bulls manage to reverse the period of underperformance, Cardano price will face resistance at $1.28, where the 21-day Simple Moving Average (SMA), 50-day SMA and middle boundary of the governing technical pattern meet.
A spike in buy orders may see the bulls push Cardano price higher toward the upper boundary of the prevailing chart pattern at $1.61, coinciding with the 100-day SMA.
Author

Sarah Tran
Independent Analyst
Sarah has closely followed the growth of blockchain technology and its adoption since 2016.


