Cardano Price Forecast: Bulls anticipate further gains as total supply in profit adds 2.34 billion ADA
- Cardano edges lower by nearly 1%, struggling to hold a decisive close above the falling channel pattern.
- The ADA supply in profits adds 2.34 billion ADA so far in July as Cardano recovers gradually.
- The technical outlook suggests that Cardano is at a crucial crossroads, targeting a potential trend reversal.

Cardano (ADA) ticks lower by 1% at press time on Friday, delaying the falling channel breakout rally. The overall recovery this week increases the Cardano supply in profit by 2.34 billion ADA tokens, potentially increasing buying pressure. The technical outlook indicates Cardano is standing at a crossroads as opposing market forces delay the breakout signal.
Rising Cardano supply in profit adds 2.34 billion ADA in July
Santiment’s data shows the Cardano supply in profit reaching 18.23 billion ADA on Friday, up from 15.89 billion ADA on Tuesday. The increase of 2.34 billion ADA supply in profit so far in July aligns with the weekly recovery and could increase the buying pressure.
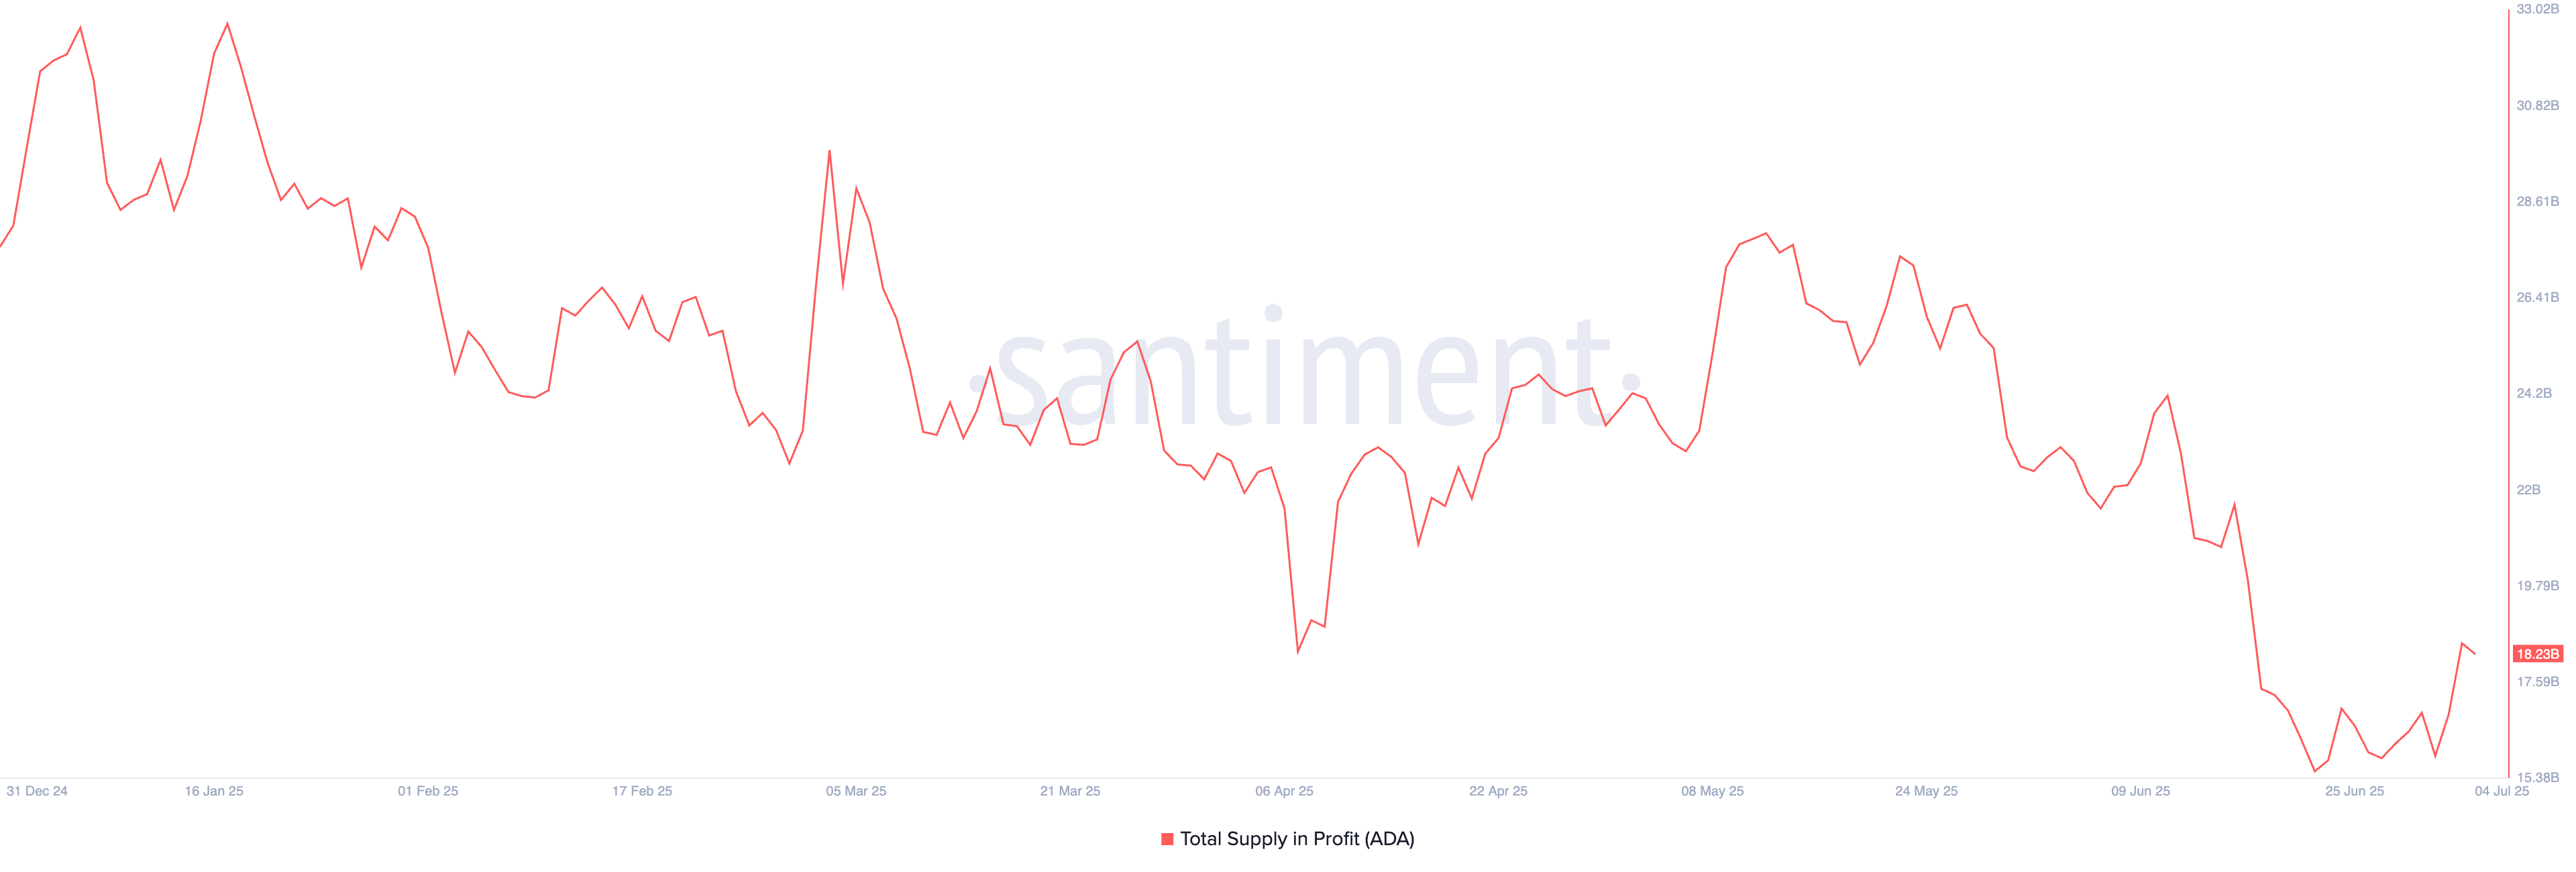
Cardano total supply in profit. Source: Santiment
The supply in profit represents the tokens acquired or last moved at a price lower than the market price. However, a significant increase poses the risk of potential profit booking.
Cardano eyes channel breakout, targeting $0.71
Cardano loses steam after posting 10% gains in the last two days, resulting in a pullback of over 1% at the time of writing on Friday. Thursday’s high of $0.6119, before closing at $0.5992, indicates an overhead supply outgrowing demand.
A resistance trendline formed by connecting the highs of May 23 and June 10, coupled with a parallel support trendline by connecting May 19 and June 5 lows, forms a falling channel pattern. Cardano floats near the resistance trendline with the intraday pullback, struggling for a decisive bullish close to signal a breakout.
If ADA holds a bullish close to the day, the uptrend could target the May 19 low at $0.7100.
The technical indicators provide mixed signals, as the Moving Average Convergence/Divergence (MACD) indicator displays a surge in green bars from the zero line, suggesting the trend momentum is shifting bullish. However, the MACD and signal line remain deep in the negative zone, indicating room for growth before turning into a flashing trend reversal signal.
The Relative Strength Index (RSI) at 47 reverts from the halfway line, reflecting a struggle to regain bullish momentum.
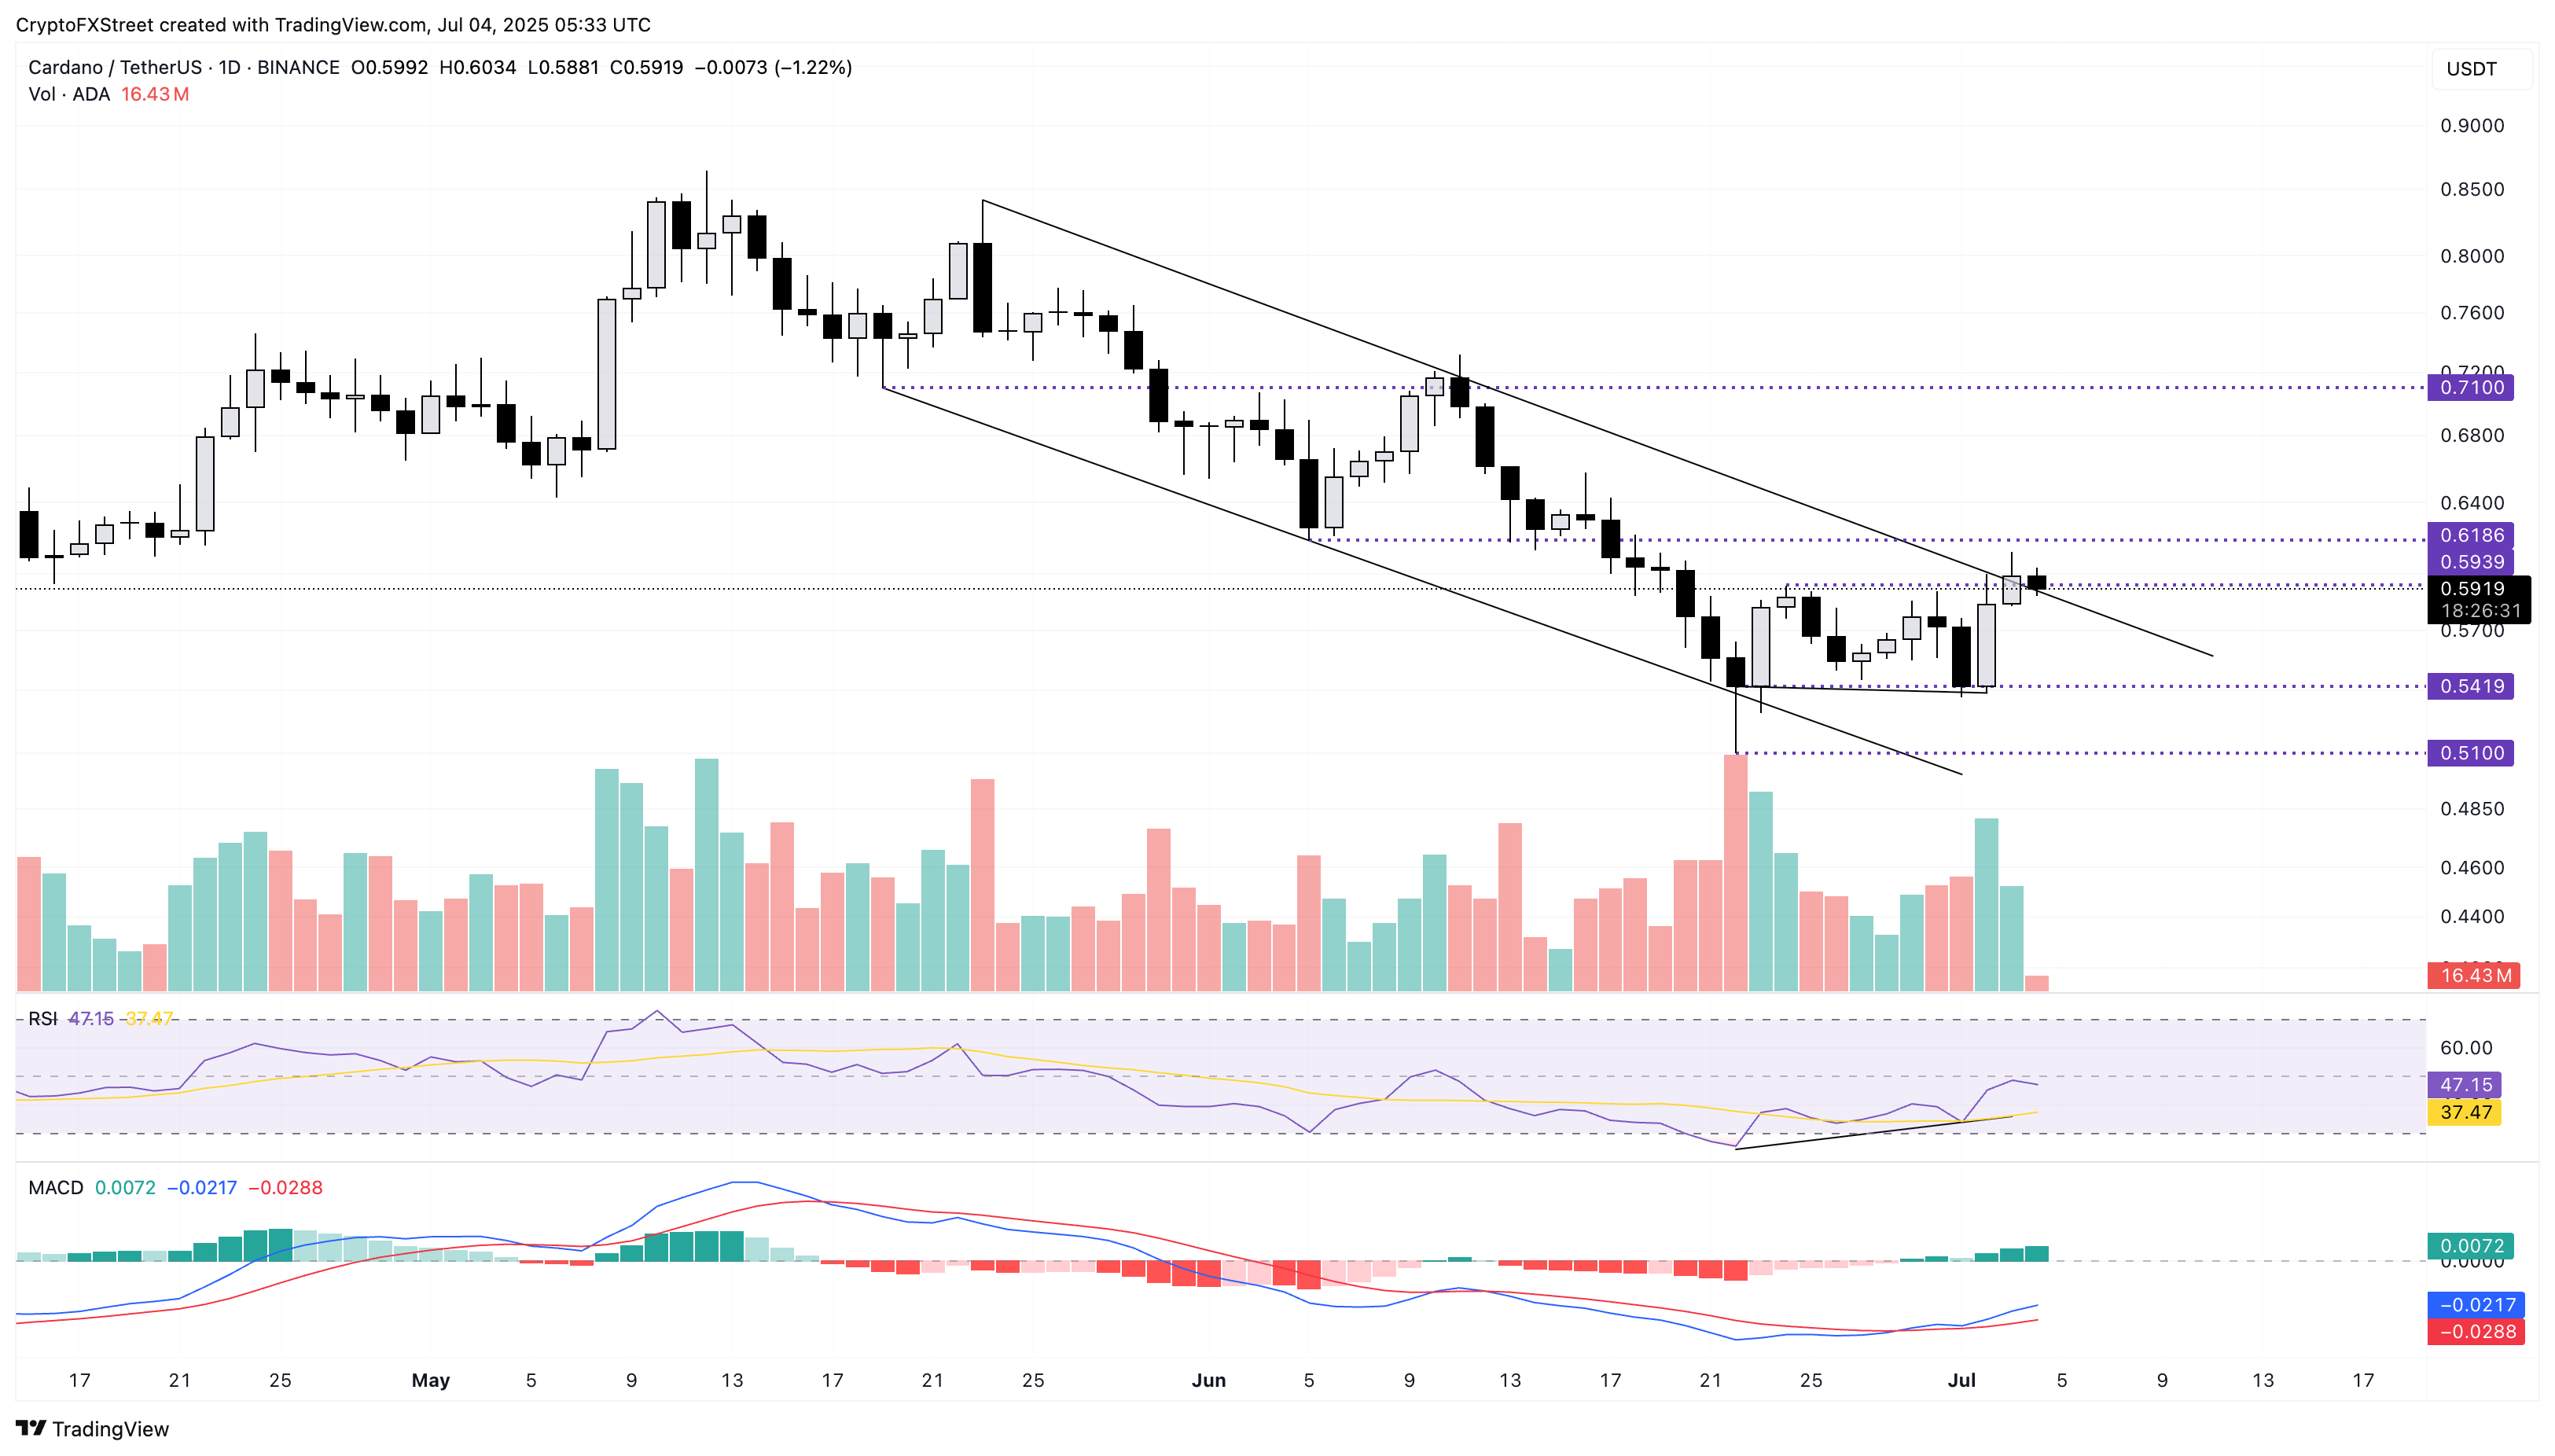
ADA/USDT daily price chart.
On the downside, if ADA marks a daily close below Thursday’s opening price of $0.5840, it could decline towards the $0.5419 support marked by the June 22 daily close.
Author

Vishal Dixit
FXStreet
Vishal Dixit holds a B.Sc. in Chemistry from Wilson College but found his true calling in the world of crypto.


