Cardano Price Forecast: ADA eyes $1 breakout as uptrend remains steady
- Cardano maintains an uptrend for the fourth consecutive day, surpassing major resistance levels.
- A steady build-up of long positions in the last three days points to a bullish incline among traders.
- The ADA Open Interest reaches a record high of $1.77 billion.

Cardano (ADA) maintains a bullish trend amid a broader market correction for the fourth consecutive day, surpassing a critical resistance level. ADA edges higher by 1% at press time on Friday with a steady rise in bullish bets and Open Interest reaching a record high of $1.77 billion. The technical outlook suggests a higher likelihood of ADA reclaiming the $1.00 psychological level.
Rising bullish bets on ADA boost Open Interest to a record high
Cardano withstood the impact of a broader market pullback on Thursday, thanks to higher-than-expected US July PPI data, which pointed to increased inflation. Traders remain interested in Cardano derivatives as the ADA Open Interest (OI) hits a record high of $1.77 billion at press time on Friday, up from $1.57 billion the previous day.
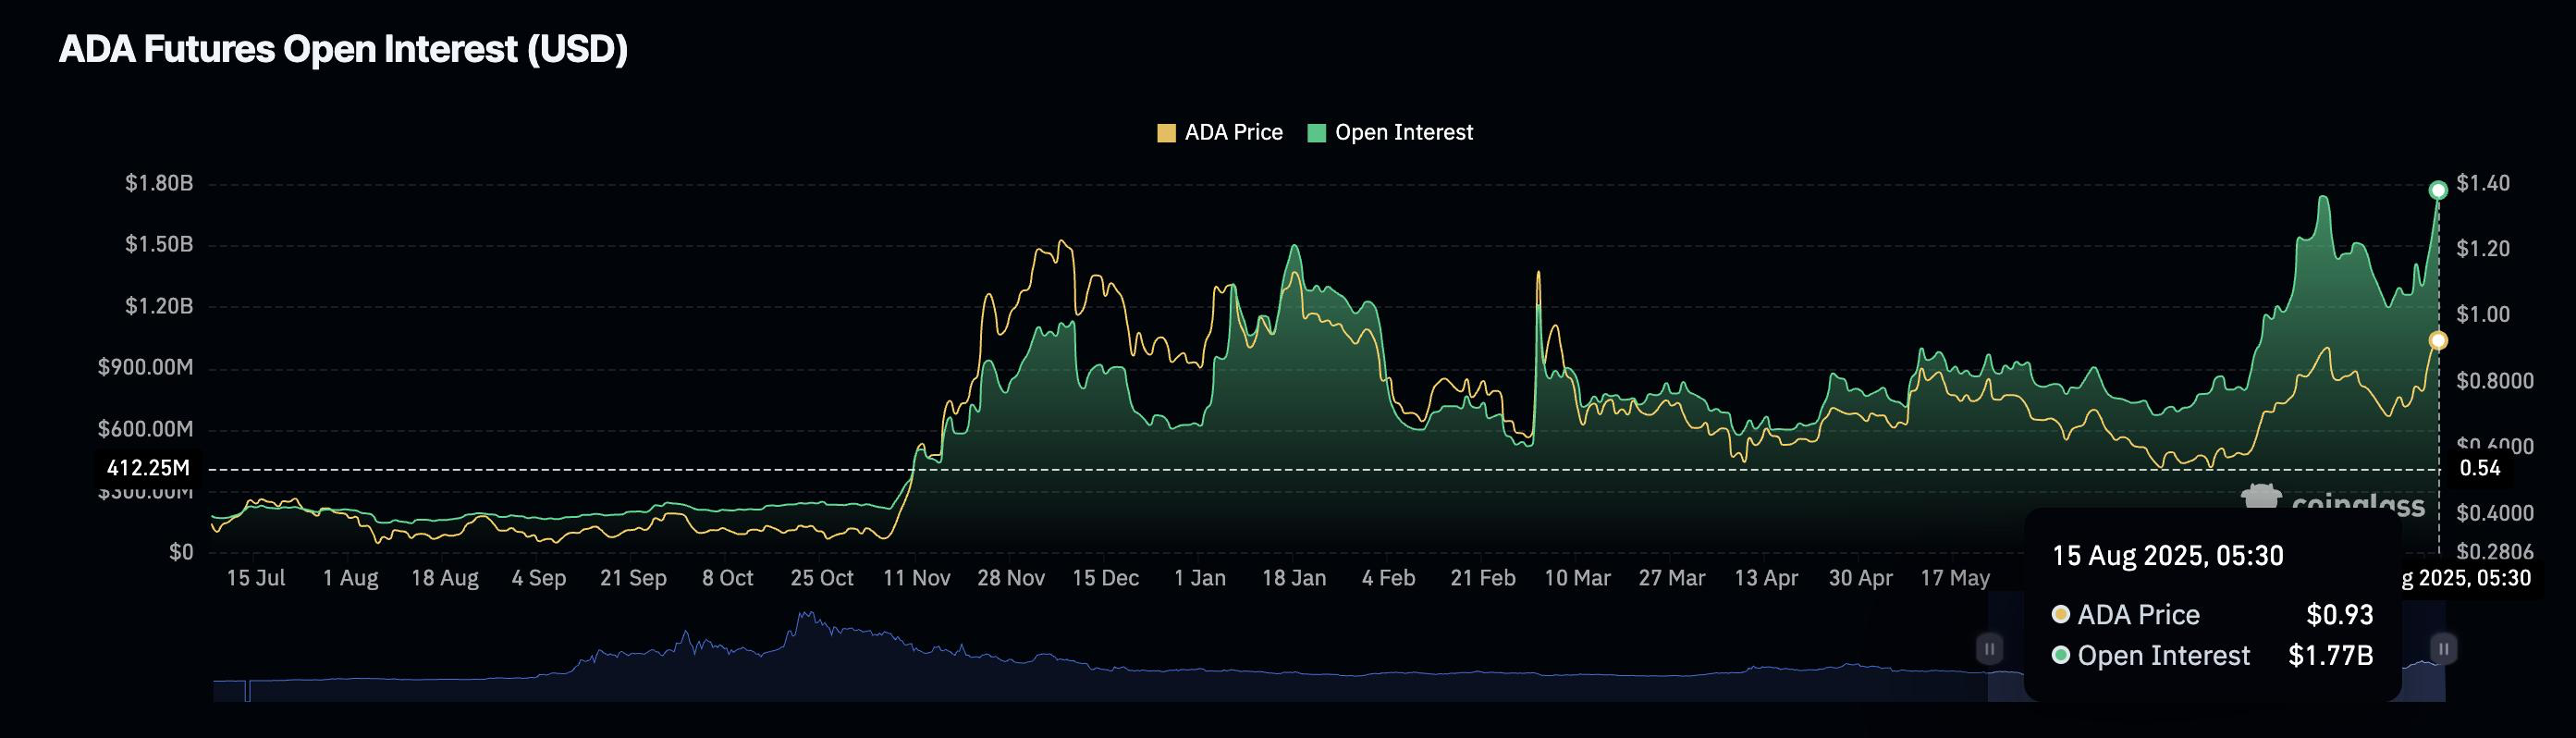
ADA Open Interest. Source: Coinglass
ADA Open Interest refers to the US Dollar (USD) value of all active Cardano futures and options contracts. The recent $200 million increment points to increased capital inflows and traders’ interest.
Amidst the capital inflows, bullish bets are on the rise, based on the taker buy/sell volume. Over the last three days, a steady rise in long positions has now accounted for 49.69% of all active positions, up from 48.07% on Wednesday, reflecting increased optimism among traders.
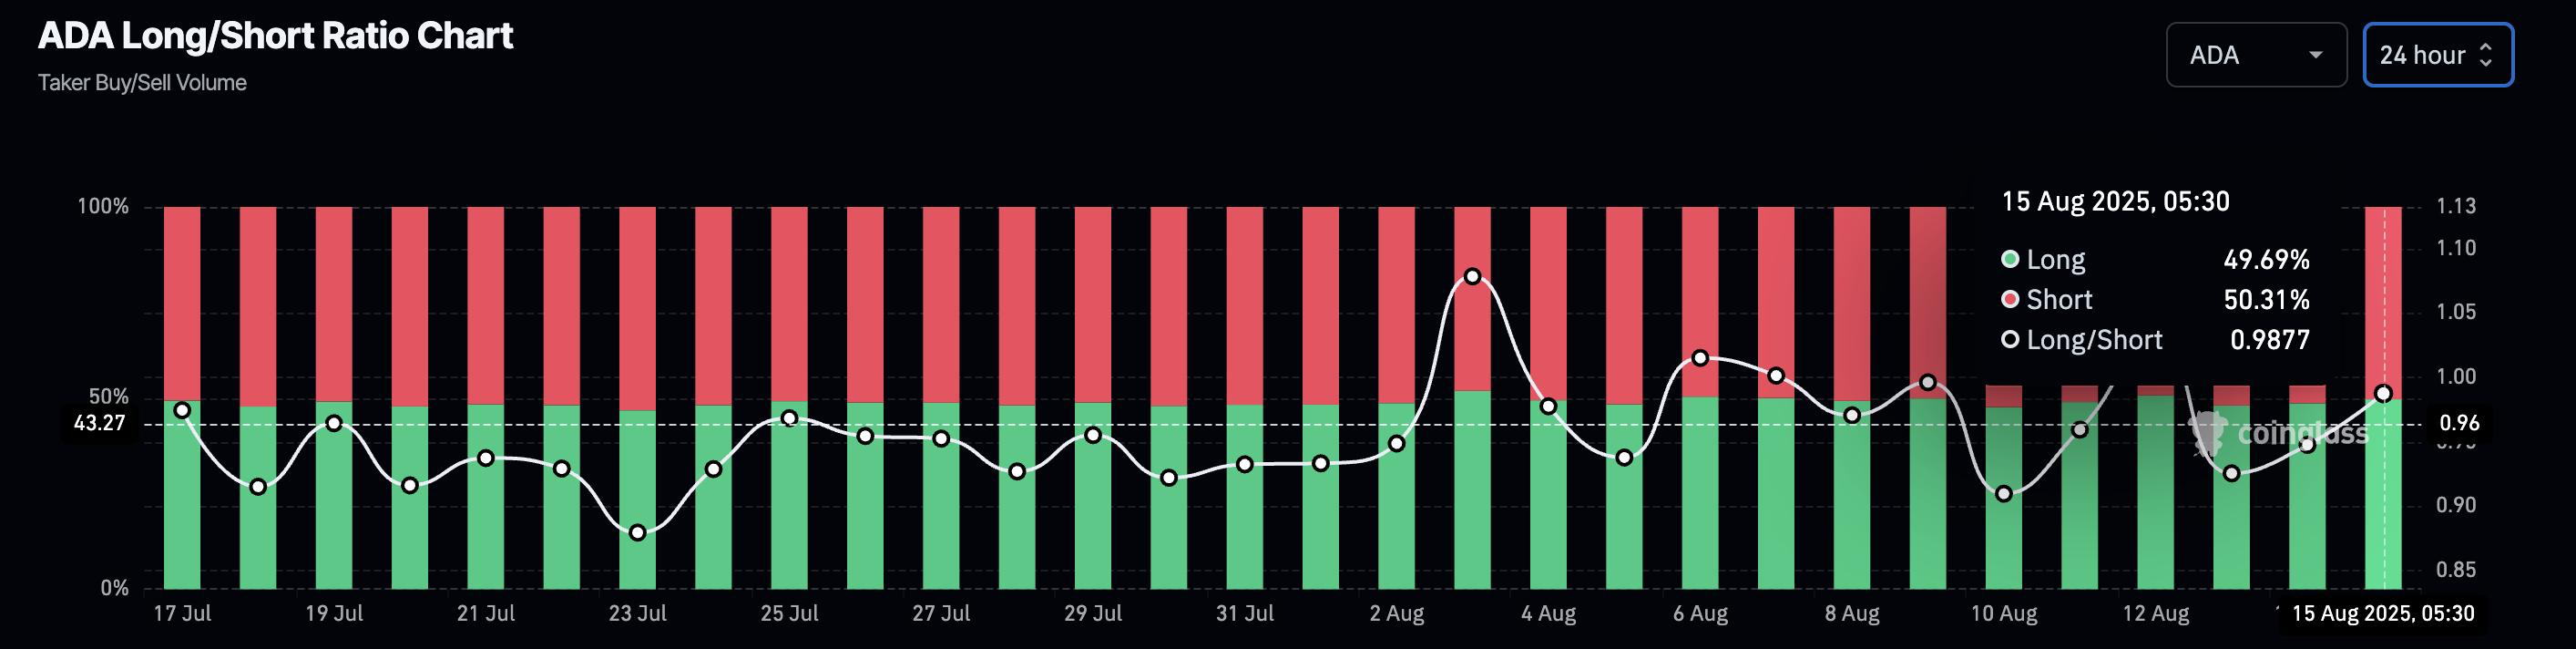
Cardano Long/Short Ratio Chart Source: Coinglass
Cardano breakout rally eyes $1
Cardano maintains an uptrend as it withstands the market correction on Thursday, closing at $0.9258, a positive outcome, after retracing from the $1.0193 high. The uptrend surpassed a long-standing resistance trendline formed by connecting the December 3 and March 3 highs, as well as the 50% retracement level at $0.9187, drawn from $1.3264 on December 3 to $0.5110 on April 7.
If Cardano upholds a close above this level, it could extend the rally to the 61.8% Fibonacci level at $1.0149.
The Moving Average Convergence Divergence (MACD) indicator displays a successive rise in green histogram bars, suggesting increased bullish momentum. Additionally, the Relative Strength Index (RSI) stands at 69, on the border of the overbought zone, as buying pressure increases.
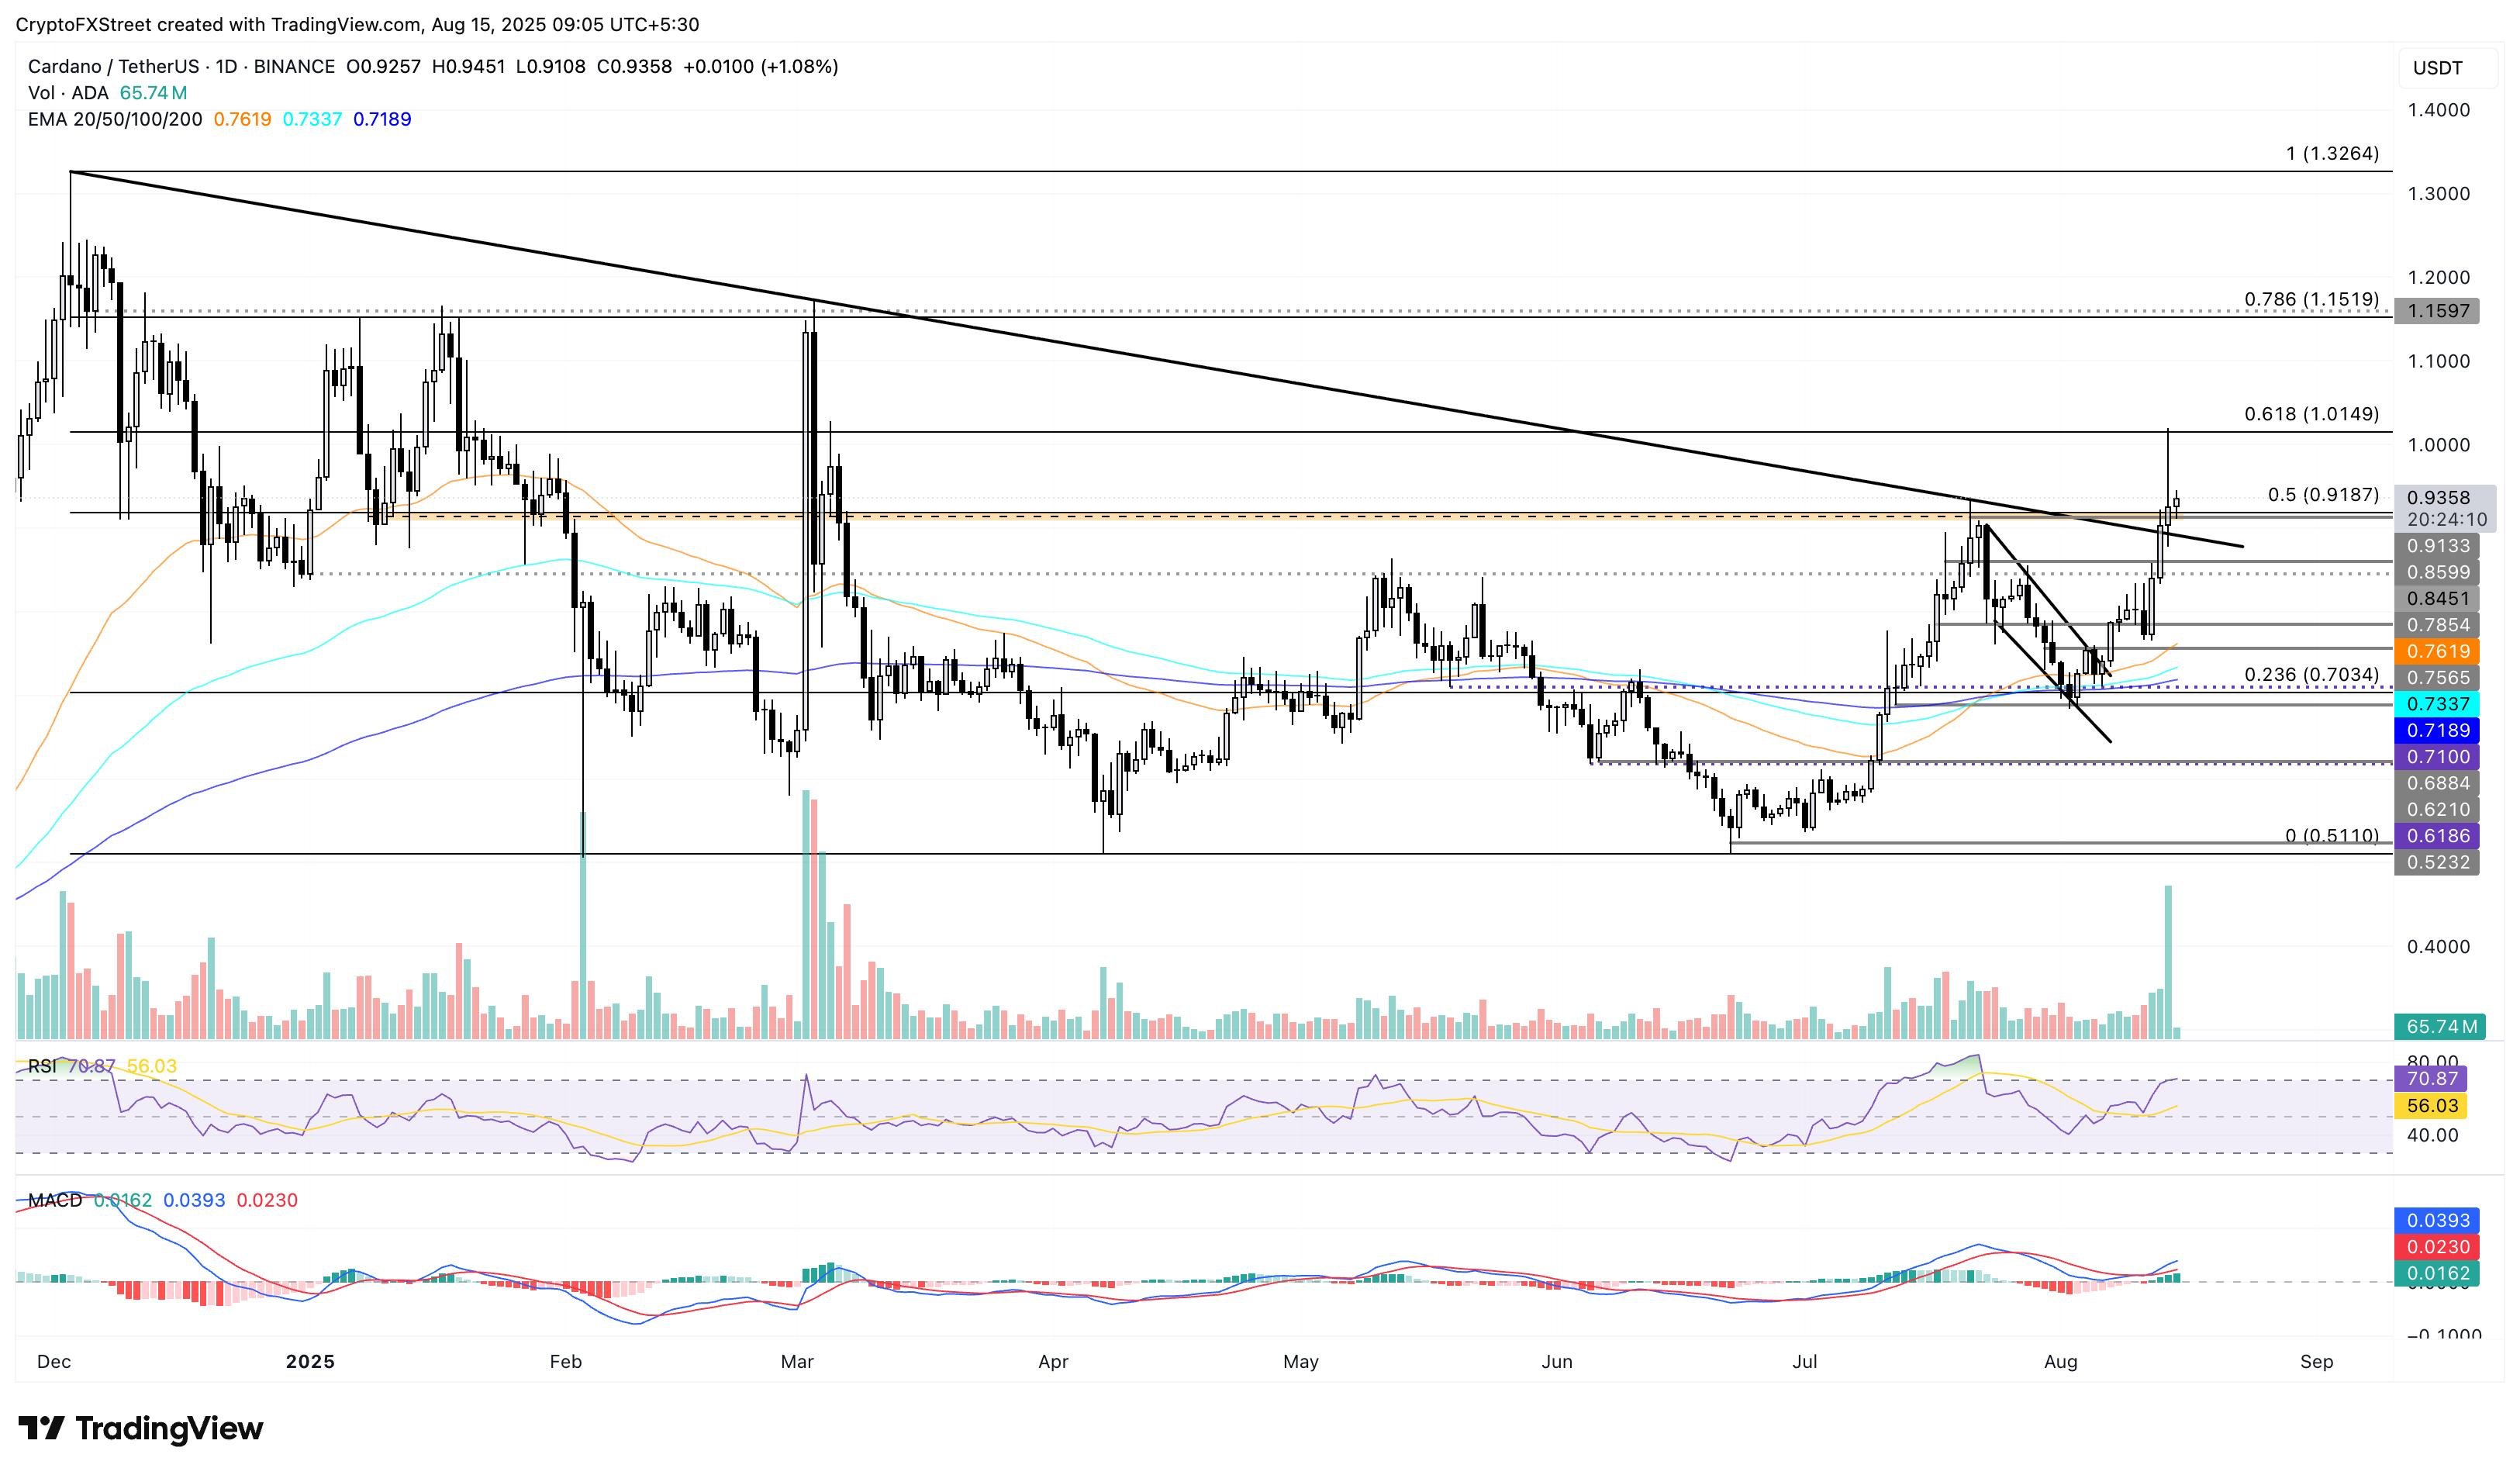
ADA/USDT daily price chart.
Looking down, a pullback below the 50% retracement level at $0.9187 could retest the broken trendline near $0.8898. However, a daily close below the trendline would invalidate the breakout rally.
Open Interest, funding rate FAQs
Higher Open Interest is associated with higher liquidity and new capital inflow to the market. This is considered the equivalent of increase in efficiency and the ongoing trend continues. When Open Interest decreases, it is considered a sign of liquidation in the market, investors are leaving and the overall demand for an asset is on a decline, fueling a bearish sentiment among investors.
Funding fees bridge the difference between spot prices and prices of futures contracts of an asset by increasing liquidation risks faced by traders. A consistently high and positive funding rate implies there is a bullish sentiment among market participants and there is an expectation of a price hike. A consistently negative funding rate for an asset implies a bearish sentiment, indicating that traders expect the cryptocurrency’s price to fall and a bearish trend reversal is likely to occur.
Author

Vishal Dixit
FXStreet
Vishal Dixit holds a B.Sc. in Chemistry from Wilson College but found his true calling in the world of crypto.


