Cardano Price Forecast: ADA bulls show signs of exhaustion as holders take profits
- Cardano slips 3.59% on Tuesday, cooling off after a 19% rally the previous week.
- On-chain data from Santiment show movement in dormant wallets, hinting at potential increased selling pressure.
- Technical analysis indicates a possible pullback toward the key support level at $0.71.

Cardano (ADA) price appears to be losing bullish momentum after a strong rally last week. At the time of writing on Tuesday, it is slipping 3.59%, trading at around $0.78. The decline suggests holders may be locking in profits following ADA’s 19% surge. Santiment data shows renewed activity from dormant wallets — a signal that long-term holders could prepare to sell. If these tokens are moved to exchanges, it may add to the downward pressure. From a technical standpoint, ADA could be on track to retest a key support level at $0.71 as the market cools off.
Holders continually book profits while dormant wallet activity rises
Cardano’s on-chain metrics show that ADA holders are booking some profits, according to Santiment's Network Realized Profit/Loss (NPL), which computes a daily network-level Return On Investment (ROI) based on the coin’s on-chain transaction volume. Strong spikes in a coin’s NPL indicate that its holders are, on average, selling their bags at a significant profit. On the other hand, strong dips imply that the coin’s holders are, on average, realizing losses, suggesting panic sell-offs and investor capitulation.
As shown in the chart below, the metric showed a strong spike on Monday, indicating that holders are, on average, selling their bags at a significant profit and increasing the selling pressure.
 [08-1747107696240.36.09, 13 May, 2025].png)
Cardano’s NPL chart. Source: Santiment.
Looking at Santiment’s Age Consumed index also raises bearish signs. The spikes in this index suggest dormant tokens (tokens stored in wallets for a long time) are in motion, and it can be used to spot short-term local tops or bottoms. As in Cardano’s case, history shows that the spikes were followed by a fall in ADA’s price as holders moved their tokens from wallets to exchanges, thereby increasing the selling pressure.
The most recent uptick on Monday was the highest spike since mid-April, which suggests ADA is ready for a downtrend.
 [08-1747107716732.36.05, 13 May, 2025].png)
Cardano Age Consumed chart. Source: Santiment
Another bearish sign is Coinglass’s ADA long-to-short ratio, which reads 0.84, the lowest level in over a month. This ratio below one reflects bearish sentiment in the markets as more traders are betting on the asset price to fall.
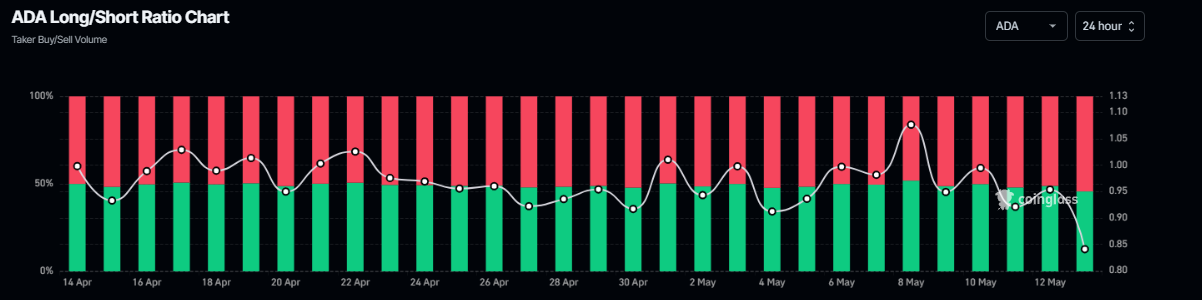
Cardano long-to-short ratio chart. Source: Coinglass
Cardano price action suggests a pullback ahead
Cardano price broke above its 200-day Exponential Moving Average (EMA) at $0.71 on Thursday and rallied 25.16% until Saturday. However, it faced resistance around the daily level of $0.84 for the next two days. This daily level coincides with the 50% price retracement level ( drawn from the March 3 high of $1.17 to the April 7 low of $0.51) at $0.84, making this a key resistance zone. At the time of writing on Tuesday, it trades slightly down at around $0.78.
If ADA continues to correct, it could extend the decline to retest its key support level at $0.71, its 200-day EMA.
The Relative Strength Index (RSI) on the daily chart reads 61, pointing downwards after being rejected from the overbought level of 70 on Saturday, indicating fading bullish momentum. If the RSI slips below its neutral level of 50, it will suggest strong bearish momentum and a sharp fall in Cardano’s price.
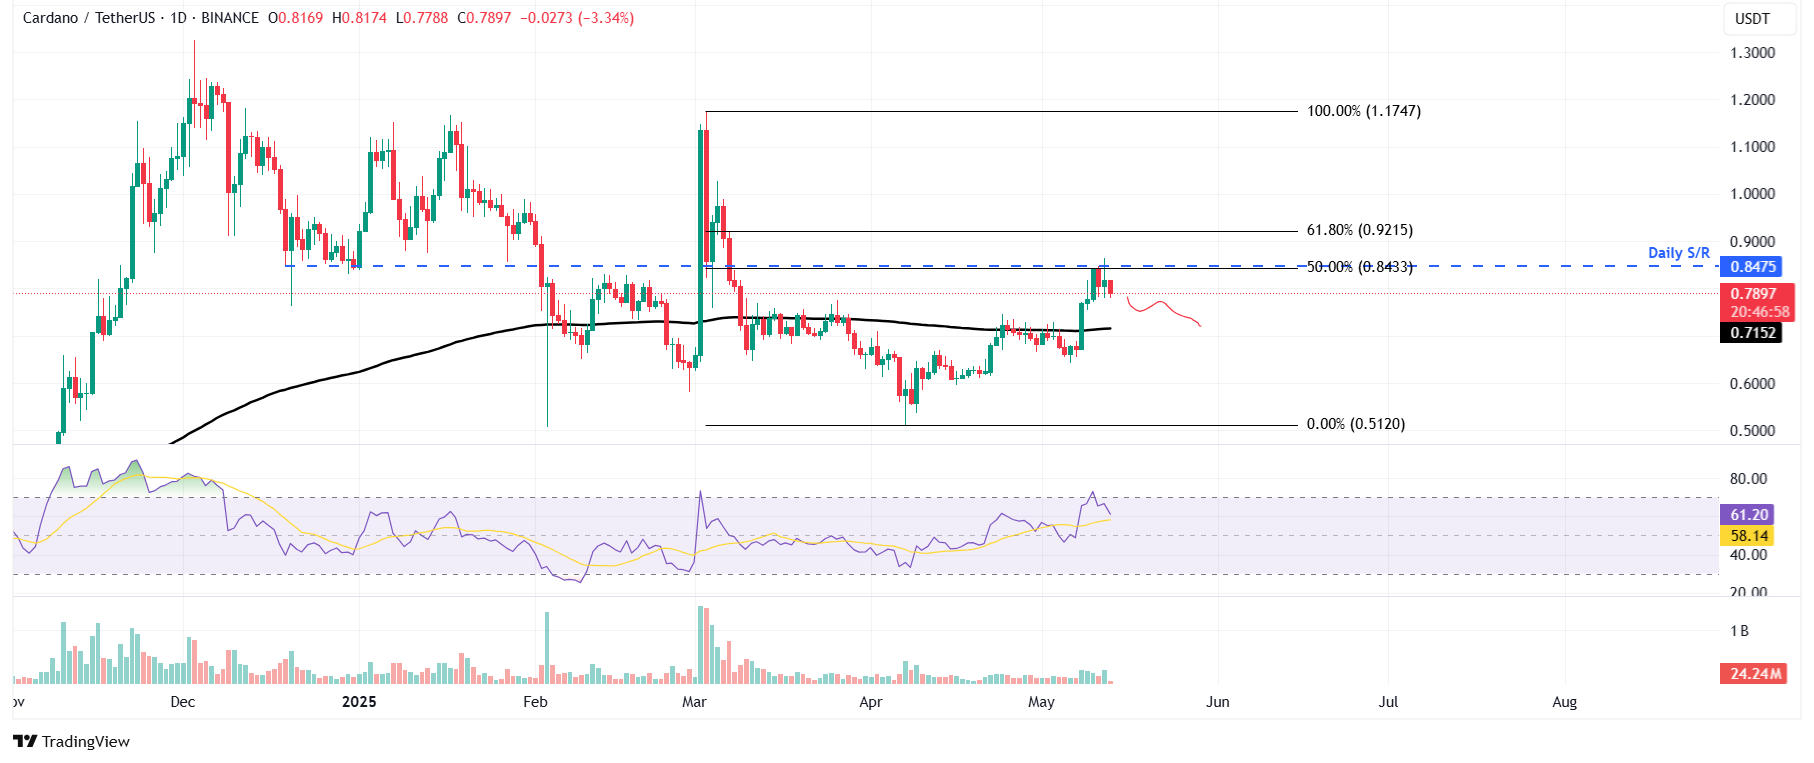
ADA/USDT daily chart
However, if Cardano breaks and closes above $0.84, it could extend the rally toward its next resistance level at $0.92, its 61.8% Fibonacci level.
Author

Manish Chhetri
FXStreet
Manish Chhetri is a crypto specialist with over four years of experience in the cryptocurrency industry.




