Cardano Price Forecast: ADA dips as profit-taking sparks selling pressure
- Cardano price trades near $0.85 on Tuesday after correcting more than 7% over the past two days.
- On-chain data indicate that holders are realizing profits, contributing to short-term selling pressure.
- The technical outlook warns of a deeper correction if ADA closes below the $0.82 support.

Cardano (ADA) price hovers around $0.85 at the time of writing on Tuesday, having declined by over 7% in the last two days. This correction comes amid ADA holders realizing profits, thereby increasing selling pressure. Traders should be cautious as a firm close below key support at $0.82 would trigger a deeper pullback.
Profit-taking by holders triggers a short-term dip
Santiment's Network Realized Profit/Loss (NPL) metric indicates that Cardano holders are booking some profit.
As shown in the graph below, the NPL experienced a significant spike on Monday, reaching its highest level since the end of July. This spike indicates that holders are, on average, selling their bags at a significant profit and increasing the selling pressure.
 [08-1757993848022-1757993848024.43.48, 16 Sep, 2025].png)
Cardano NPL chart. Source: Santiment
Apart from this rising profit-taking activity, Coinglass' long-to-short ratio stood at 0.87 on Tuesday, the lowest level in over a month. The ratio below one indicates a bearish sentiment in the market, as traders are betting that ADA prices will fall.
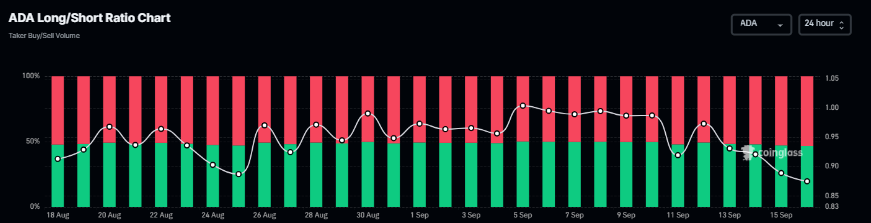
Cardano long-to-short ratio chart. Source: Coinglass
Cardano Price Forecast: ADA risks a deeper correction if it closes below key support
Cardano price broke above the daily support level at $0.84 on September 8 and rallied by 9% over the next five days. However, it failed to maintain the upward momentum on Sunday and declined 7.66% by Monday. At the time of writing on Tuesday, it hovers at around $0.85.
If ADA continues its pullback and closes below the 61.8% Fibonacci retracement level at $0.82, it could extend the decline toward its next support level at $0.76.
The Relative Strength Index (RSI) reads 49, slipping below its neutral level of 50, indicating early signs of bearish momentum. The Moving Average Convergence Divergence (MACD) lines are also converging to a bearish crossover. A successful bearish crossover on a daily basis would further support the bearish view and suggest a downward trend ahead.
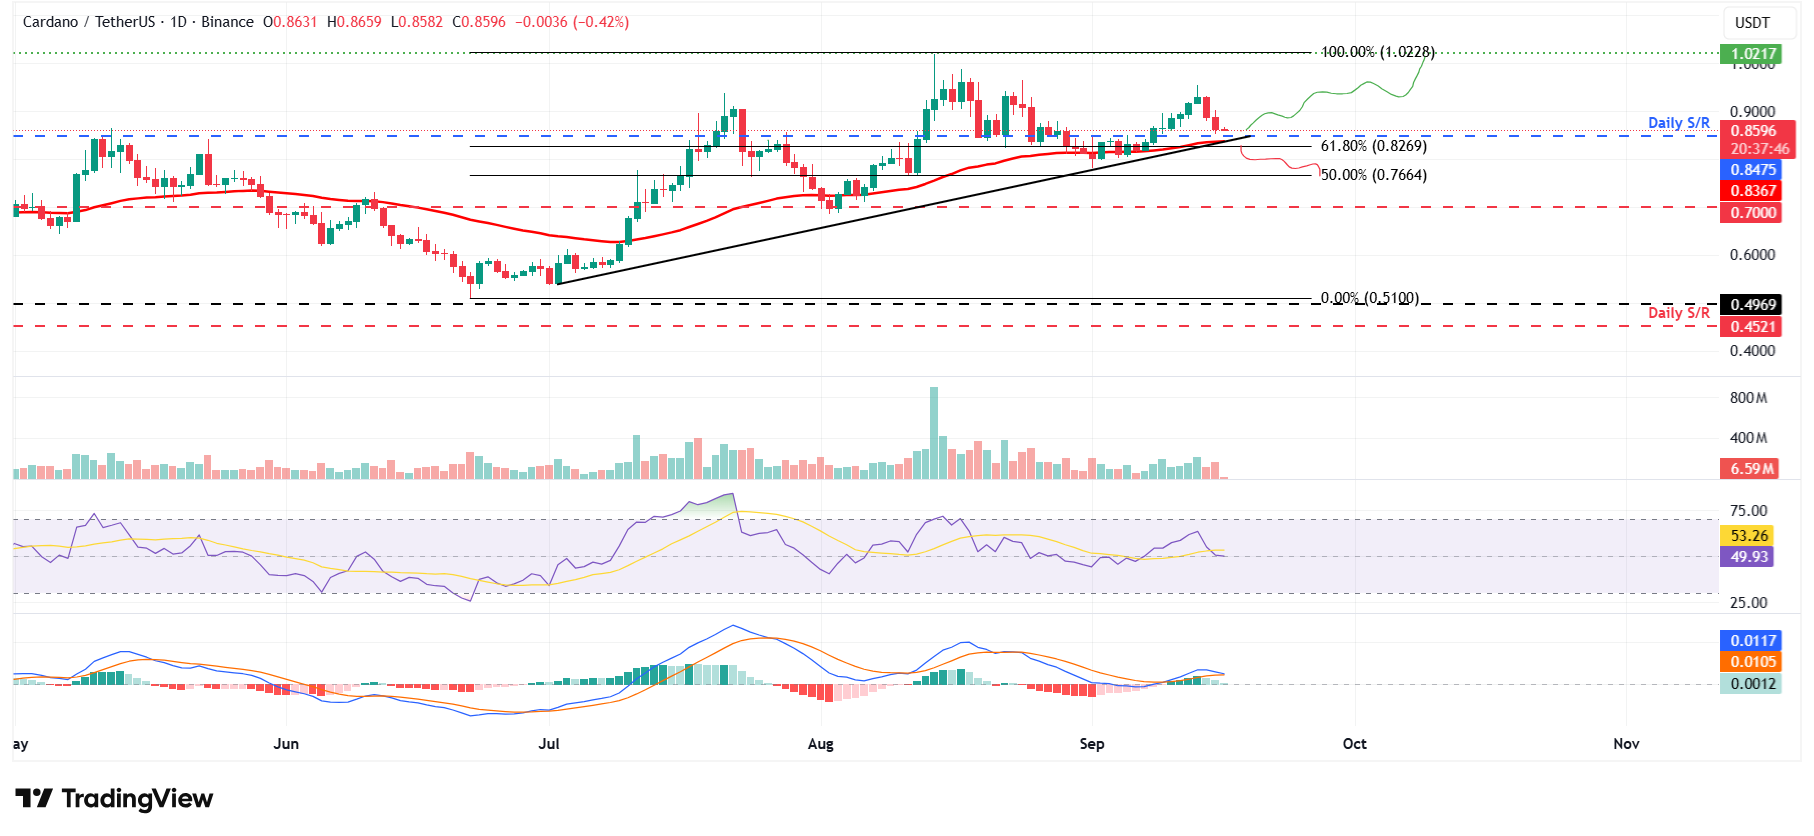
ADA/USDT daily chart
However, if ADA finds support around the daily level at $0.84, it could extend the recovery toward its August 14 high of $1.02.
Author

Manish Chhetri
FXStreet
Manish Chhetri is a crypto specialist with over four years of experience in the cryptocurrency industry.



