Cardano price flashes major sign of recovery, but ADA bulls have doubts
- Cardano price is aiming to recuperate recent losses as bulls gear up for a bounce.
- However, the road to recovery may not be easy, as multiple roadblocks have emerged.
- Only a slice above $2.50 could see ADA resume its rally.

Cardano price is gearing up for a recovery after recording a local bottom at $1.90, the lowest point recorded since August 18. A key technical indicator suggests that ADA is ready to reverse the period of underperformance.
Cardano price struggles with sturdy headwind
Cardano price is preparing to overturn the period of sluggish performance as the Momentum Reversal Indicator (MRI) has printed a bottom signal on September 21 on the 12-hour chart. The indicator also flashed a bottom signal on the September 23 candle on the daily chart, further suggesting that ADA is primed to bounce.
Before the bulls could target bigger aspirations, Cardano price is confronted with several major levels of resistance. The first hurdle for ADA appears to be at the 20 twelve-hour Simple Moving Average (SMA) at $2.30. However, IntoTheBlock’s In/Out of the Money Around Price (IOMAP) data shows that this level only acts as a small headwind for the Ethereum killer.
The following obstacle for Cardano price is at $2.36, where the 38.2% Fibonacci retracement level and the 100 twelve-hour SMA meet. Another major hurdle will emerge at $2.44, as indicated by the resistance line given by the MRI.
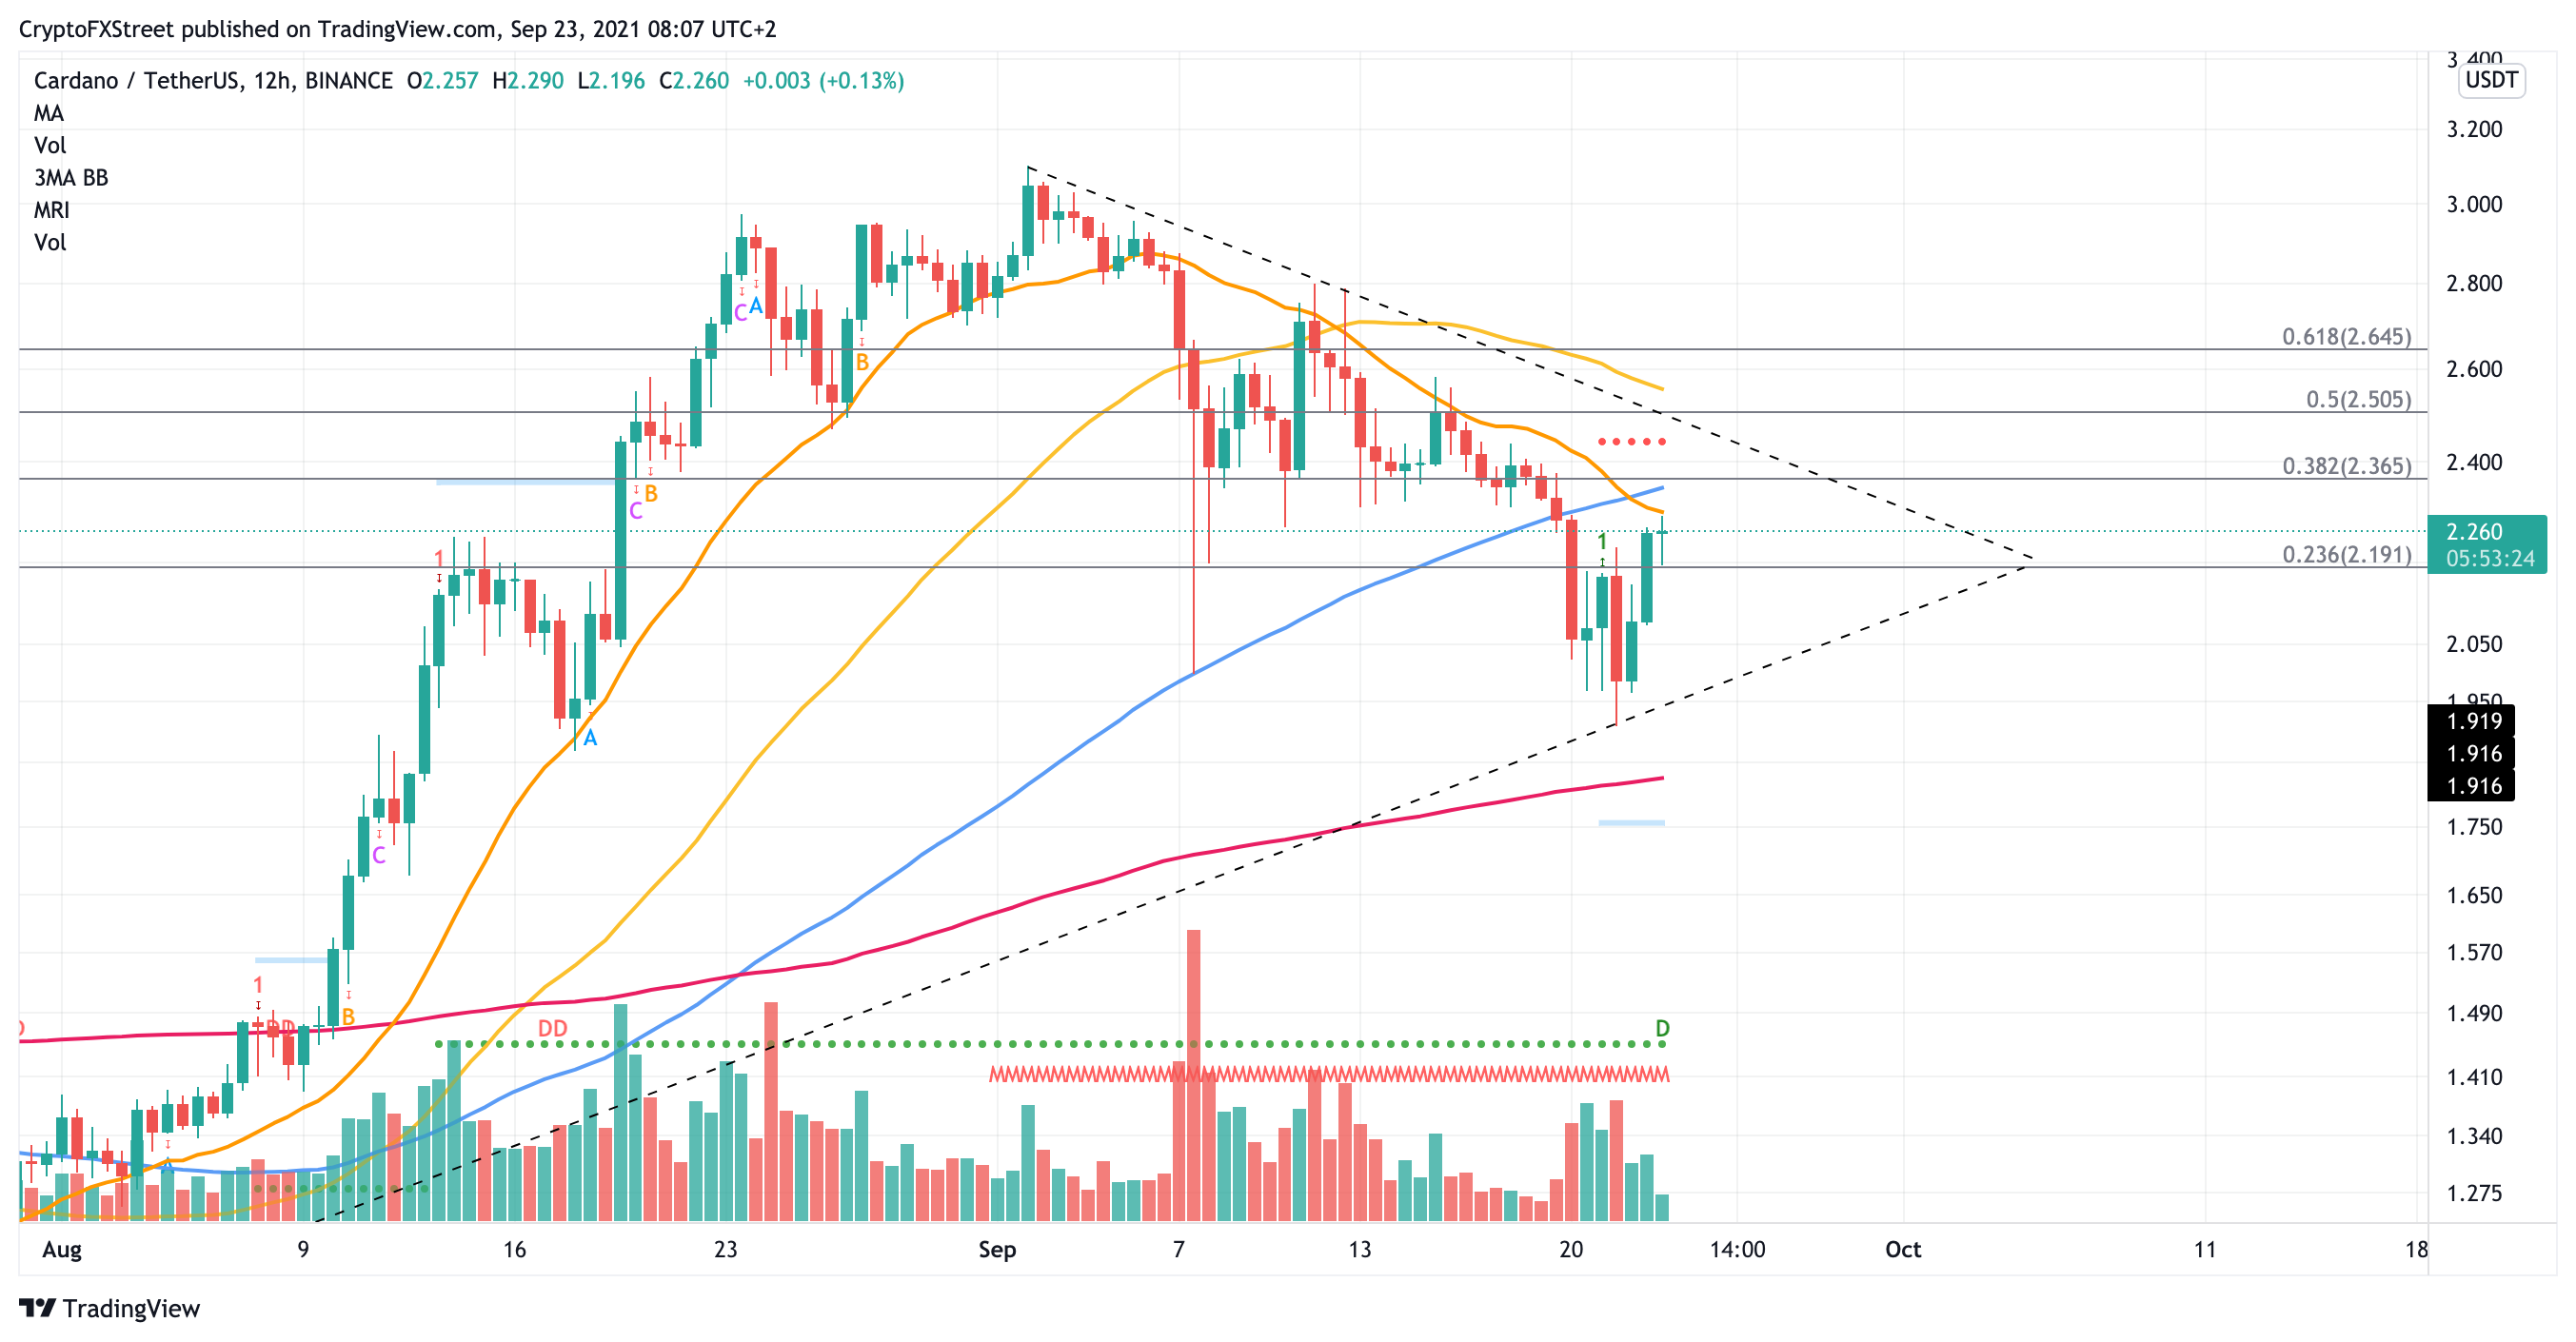
ADA/USDT 12-hour chart
The IOMAP data also shows the aforementioned level appears to be the biggest area of resistance, where 72,340 addresses purchased 1.55 billion ADA at $2.44. Only if Cardano price manages to reach this level, would ADA have the potential to tag the diagonal resistance trend line that extends from its all-time high recorded on September 2.
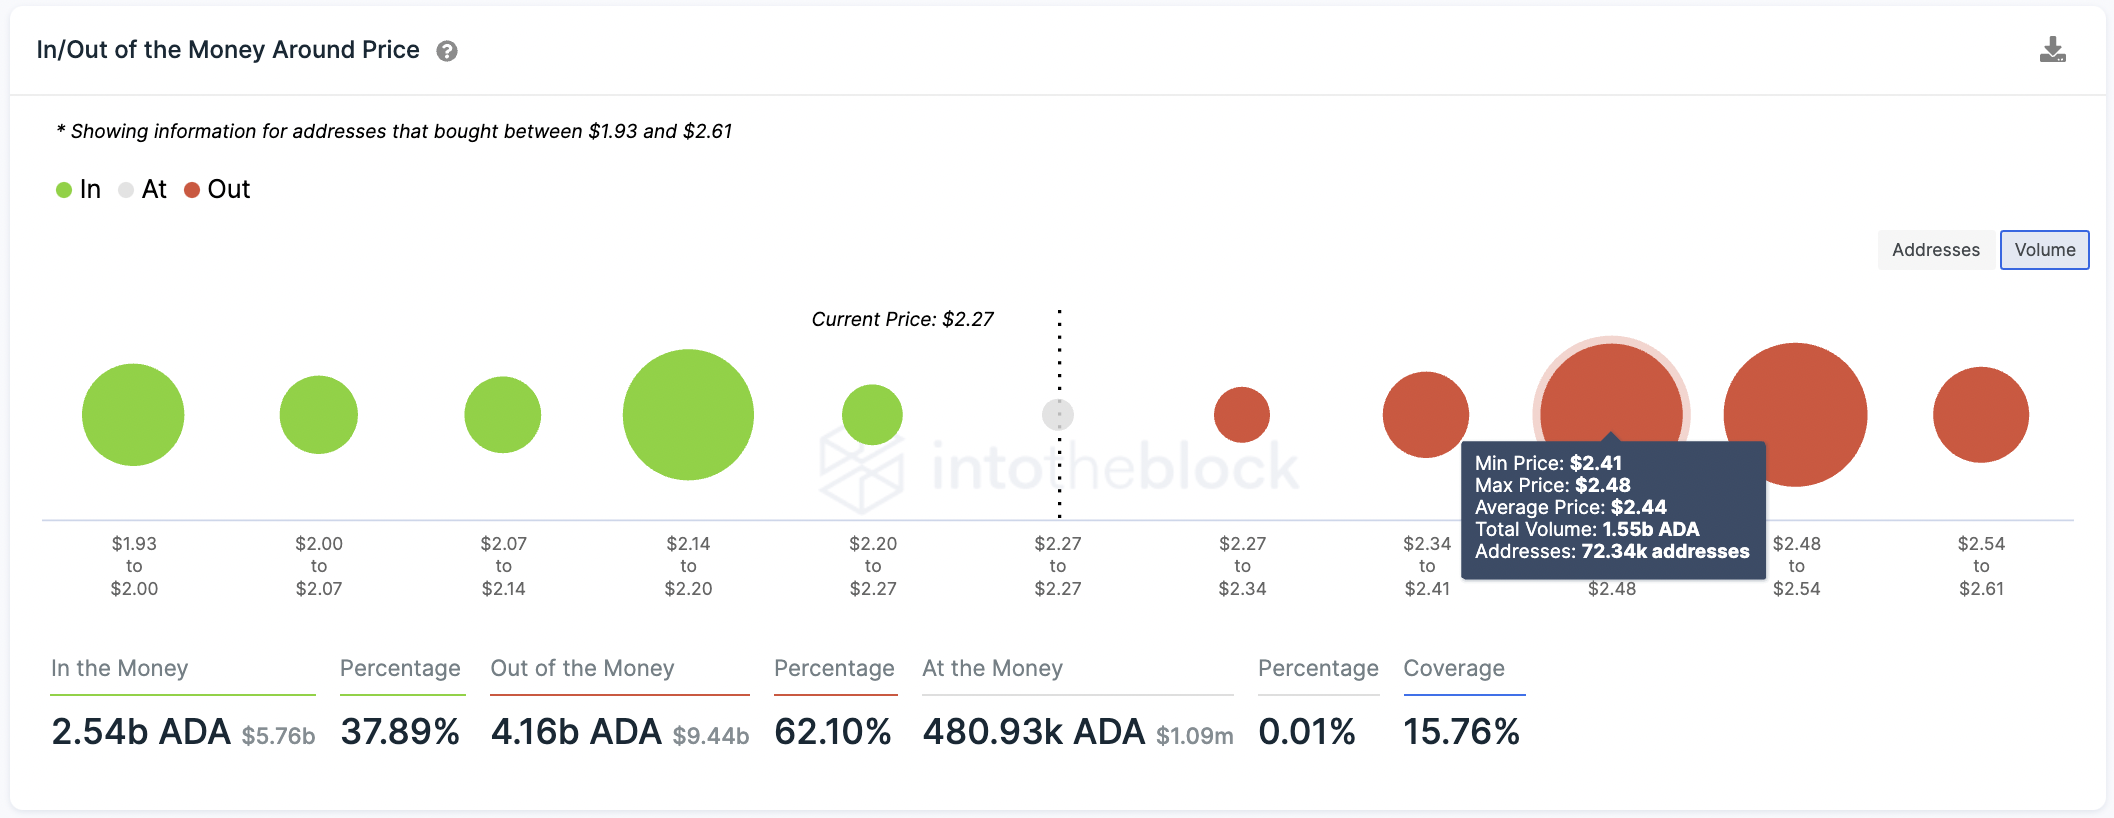
ADA IOMAP
Only a slice above $2.50, where the 50% Fibonacci retracement level at the diagonal trend line meets, would open up the possibility of ADA rallying and breaking the prevailing downtrend. However, bullish investors should note that this area also seems to be a major area of resistance for Cardano price as indicated by IOMAP data.
Further resistance may appear at the 50 twelve-hour SMA at $2.56 should Cardano price successfully break above the diagonal trend line.
Despite the optimism given by the MRI bottom signals, Cardano price continues to skate on thin ice as breaking below a critical support level could spell trouble for the bulls.
Cardano price would discover immediate support at the 23.6% Fibonacci retracement level at $2.19. Should a spike in sell orders materialize, ADA could fall further to tag the diagonal support trend line at $1.95.
Author

Sarah Tran
Independent Analyst
Sarah has closely followed the growth of blockchain technology and its adoption since 2016.


