Cardano price at make-or-break point while ADA remains indecisive
- Cardano price is traversing a symmetrical triangle pattern, suggesting that a 16% explosive move is likely.
- A decisive close above the setup’s lower trend line will knock ADA down to the $1.99 to $2.10 demand zone.
- Transactional data shows that the resistance barriers are hogging the bulls’ path.

Cardano price has been on a tight consolidative move for more than a month. However, this coiling up is a precursor to an explosive move. While on-chain metrics are all hinting at a bearish outlook, technicals suggest that there is hope.
Cardano price shows lack of buyer interest
Cardano price has set up three distinctive lower highs and five higher lows since September 21. Connecting these trend lines shows that the price action is squeezed and reveals the formation of a symmetrical triangle.
Since this pattern has no directional bias, it could break out either way. The target for this technical formation is obtained by adding the distance between the first swing high and swing low to the breakout point.
While the situation might seem black and white, it is not. Investors can expect Cardano price to breach the lower trend line first and enter the demand zone ranging from $1.99 to $2.10.
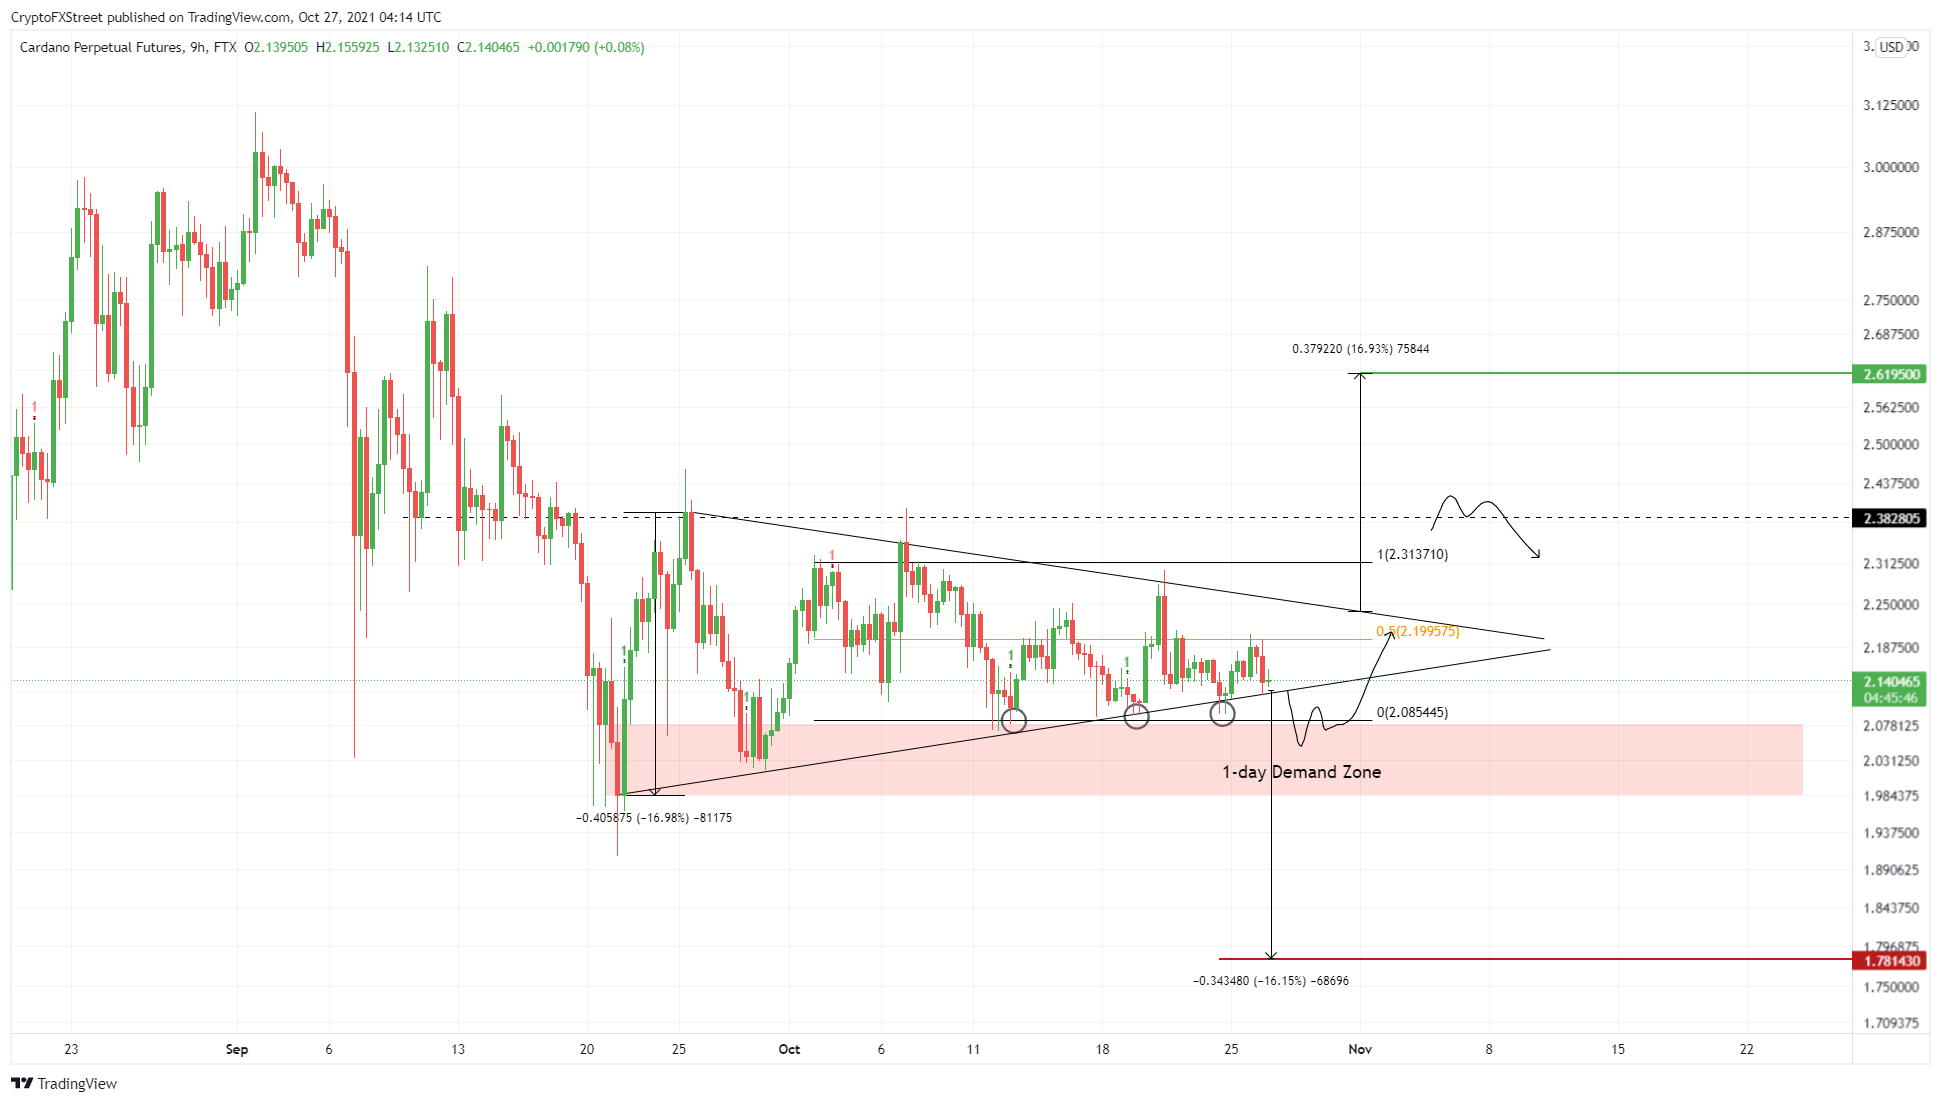
ADA/USDT 9-hour chart
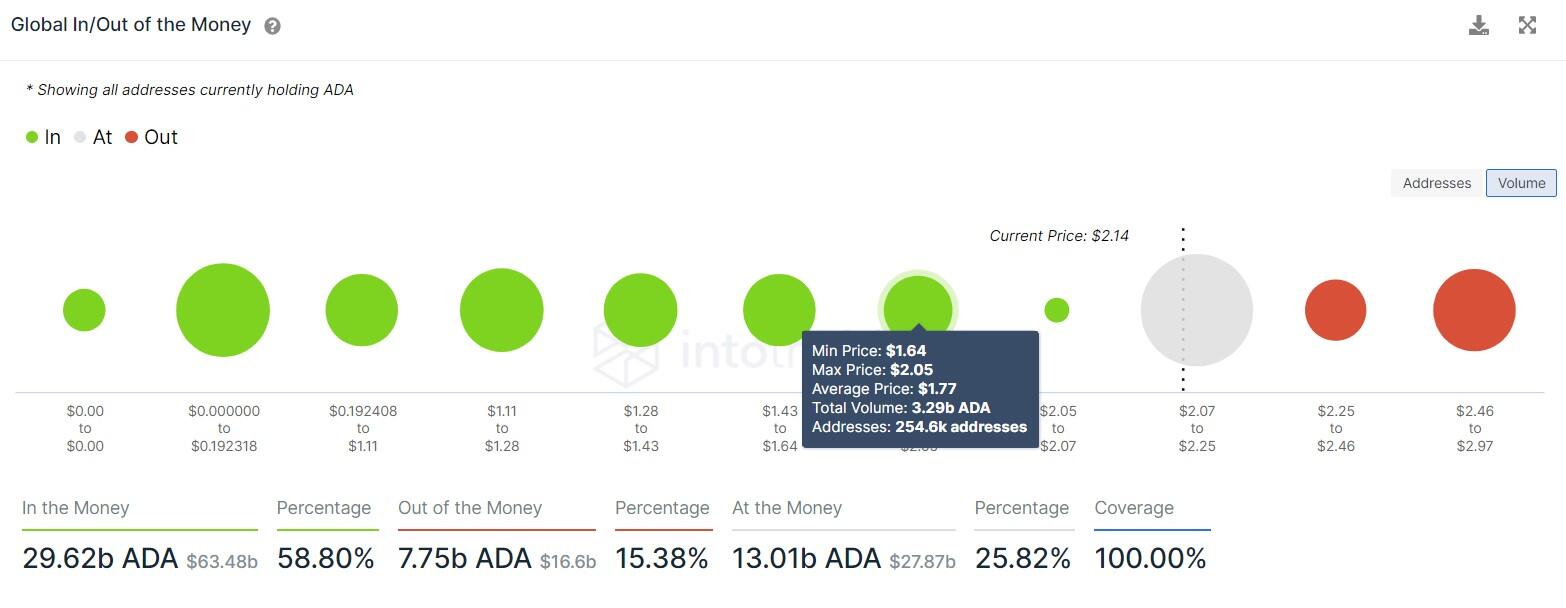
IntoTheBlock’s Global In/Out of the Money (GIOM) model shows that the immediate yet stable support level is $2.11, where roughly 147,87 addresses purchased a whopping 2.85 billion ADA.
Although the bullish move assumes that ADA bounces off the $1.99 to $2.10 demand zone, a decisive close below this area will put these investors “Out of the Money,” further increasing the selling pressure and invalidating the bullish thesis.
In this case, ADA might continue its descent and head toward its intended target at $1.78.

ADA GIOM chart
Further adding credence to the bearish outlook is the 60.7% decline in the number of large transactions worth $100,000 or more.
This on-chain metric serves as a proxy of high-net-worth individuals and can often help spot bullish trends. However, over the past six months, the number of such transactions has dropped from $3,500 to $1,370, indicating a reduction in institutional money flows.
ADA large transaction chart
While things are looking gloomy for the Ethereum killer, the demand zone ranging from $1.99 to $2.10 could be the salvation for bulls.
If the buying pressure increases, pushing ADA to re-enter the symmetrical triangle, there is still a chance that Cardano price will make a run at the upper trend line. A decisive close above $2.24 will put an end to the bearish thesis and indicate a bullish breakout from the symmetrical triangle, propelling ADA by 16% to $2.62.
Author

Akash Girimath
FXStreet
Akash Girimath is a Mechanical Engineer interested in the chaos of the financial markets. Trying to make sense of this convoluted yet fascinating space, he switched his engineering job to become a crypto reporter and analyst.


