Cardano Elliott Wave technical analysis [Video]
![Cardano Elliott Wave technical analysis [Video]](https://editorial.fxsstatic.com/images/i/ADA-bearish-animal_XtraLarge.png)
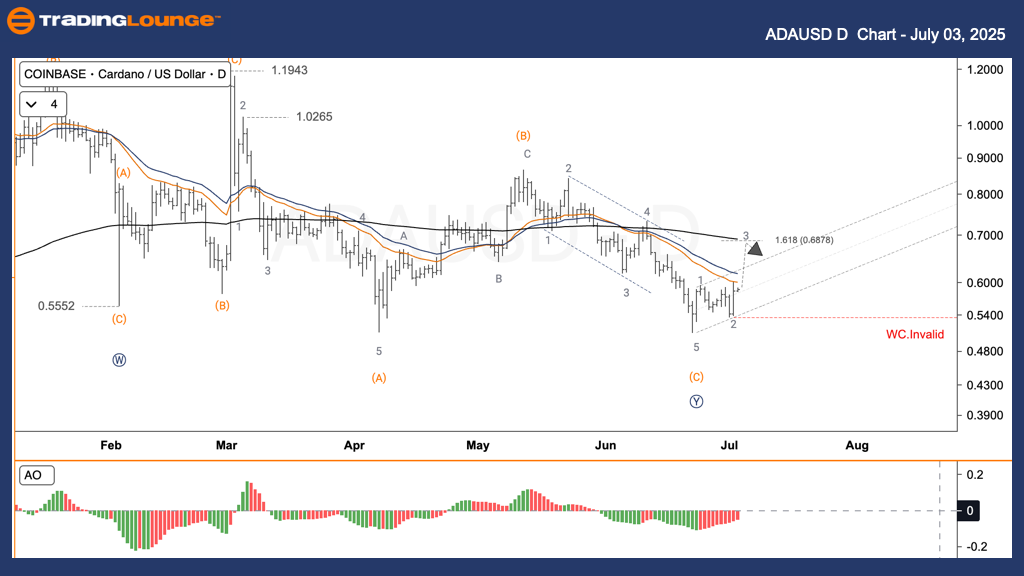
ADA/USD Elliott Wave analysis – Daily chart
Function: Follow Trend.
Mode: Motive.
Structure: Impulse.
Position: Wave 2.
Direction next higher degrees: Wave 3 (developing).
Wave cancel invalid level: Not specified.
The ADAUSD daily chart indicates the completion of both wave 1 and wave 2 within a bullish impulsive structure. Wave 2 retraced near the Fibonacci 0.618 level at approximately 0.543 USD. Currently, wave 3 is emerging with an expected Fibonacci 1.618 extension target from wave 1 around 0.685 USD.
Trading strategy
-
For short-term traders (swing trade):
-
Consider buying during dips.
-
Set Stop Loss just below 0.511 USD.
-
-
Risk management is critical. Price moving below 0.511 USD invalidates the bullish outlook in the short term.
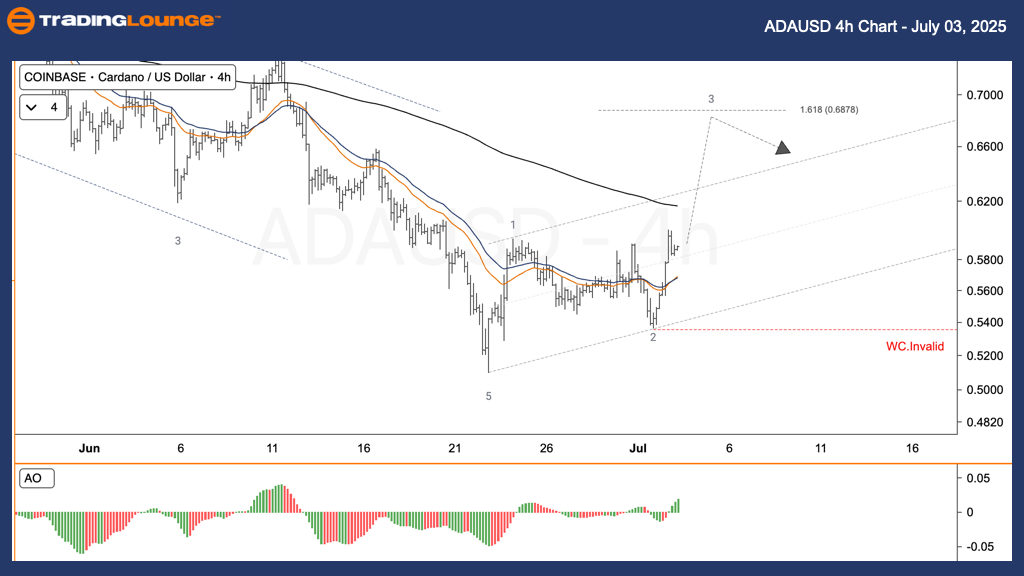
ADA/USD Elliott Wave technical analysis – Four-hour chart
Function: Follow Trend.
Mode: Motive.
Structure: Impulse.
Position: Wave 2.
Direction next higher degrees: Wave 3 (developing).
Wave cancel invalid level: Not specified.
The H4 chart mirrors the daily analysis. Wave 1 and 2 of the uptrend are complete, with wave 2 hitting the 0.618 Fibonacci retracement near 0.543 USD. An impulsive wave 3 is likely forming, targeting approximately 0.685 USD based on wave 1's 1.618 Fibonacci projection.
Trading strategy
-
Swing trade approach:
-
Look for buy opportunities during retracements.
-
Maintain Stop Loss below 0.511 USD to manage risk effectively.
-
-
A break below 0.511 USD calls for re-evaluation of the current bullish setup.
Cardano (ADA/USD) Elliott Wave technical analysis [Video]
Author

Peter Mathers
TradingLounge
Peter Mathers started actively trading in 1982. He began his career at Hoei and Shoin, a Japanese futures trading company.


