Is the launch of Dogechain going to help Dogecoin price rebound?
- Dogecoin price is hovering above the $0.048 support level after a 72% crash in the last 70 days.
- The MRI indicator flashes a buy signal on the weekly time frame, suggesting the possibility of a bottom.
- A weekly candlestick close below $0.048 will invalidate the bullish thesis and signals for DOGE.

Dogecoin price has flipped multiple support levels into hurdles since May 2021. The most recent crash caused by varied factors seems to have taken the most toll on DOGE. Despite the bleak outlook on the crypto markets, this technical indicator is hinting at a potential recovery rally.
Dogechain: The DOGE Testnet
Adding a bit of bullishness to this recovery outlook is the launch of the Dogechain testnet on June 15. The new testnet is built on the Polygon Edge, which provides DOGE developers with a new blockchain network while “providing full compatibility with Ethereum smart contracts and transactions.”
The Dogechain will use the Istanbul Byzantine Fault Tolerant (IBFT) consensus mechanism and support Proof of Stake (PoS).
This revamp, could hopefully, breathe life into Dogecoin and its market value, which has remained lull since the appearance of Dogecoin-killer Shiba Inu.
Dogecoin price is ready for reversal
Dogecoin price has produced three distinctive lower highs that can be connected using a trend line. Doing so reveals that any attempts at recovery during the 93% crash were hammered by this trend line.
As a result, DOGE shattered the $0.070-to-$0.087 support area, flipping it into a resistance barrier. Interestingly, the Dogecoin price came close to retesting the $0.048 foothold but failed as buyers stepped in.
While the overall outlook of the market is still drenched in a bearish bias, the Momentum Reversal Indicator (MRI) seems to have come alive and hints at a potential reversal. The green ‘one’ buy signal on the weekly chart by the MRI, forecasts a one-to-four candlestick upswing for DOGE.
Although investors might be unsure, this signal has been accurate to the T, the last few times it popped up.
For example, the bull run top was signaled by a red ‘one’ down arrow by the MRI on May 10, which was followed by a 90% crash. The exponential rally in late 2020 was also marked by a top signal, which led to a 31% downswing.
The last time this indicator flashed a green ‘one’ buy signal, the Dogecoin price rallied 445% in two months or so.
Therefore, investors need to be cautiously optimistic about this buy signal for the Dogecoin price. If this truly is the bottom, then DOGE could rally 81% to $0.109 before facing a sell-off.
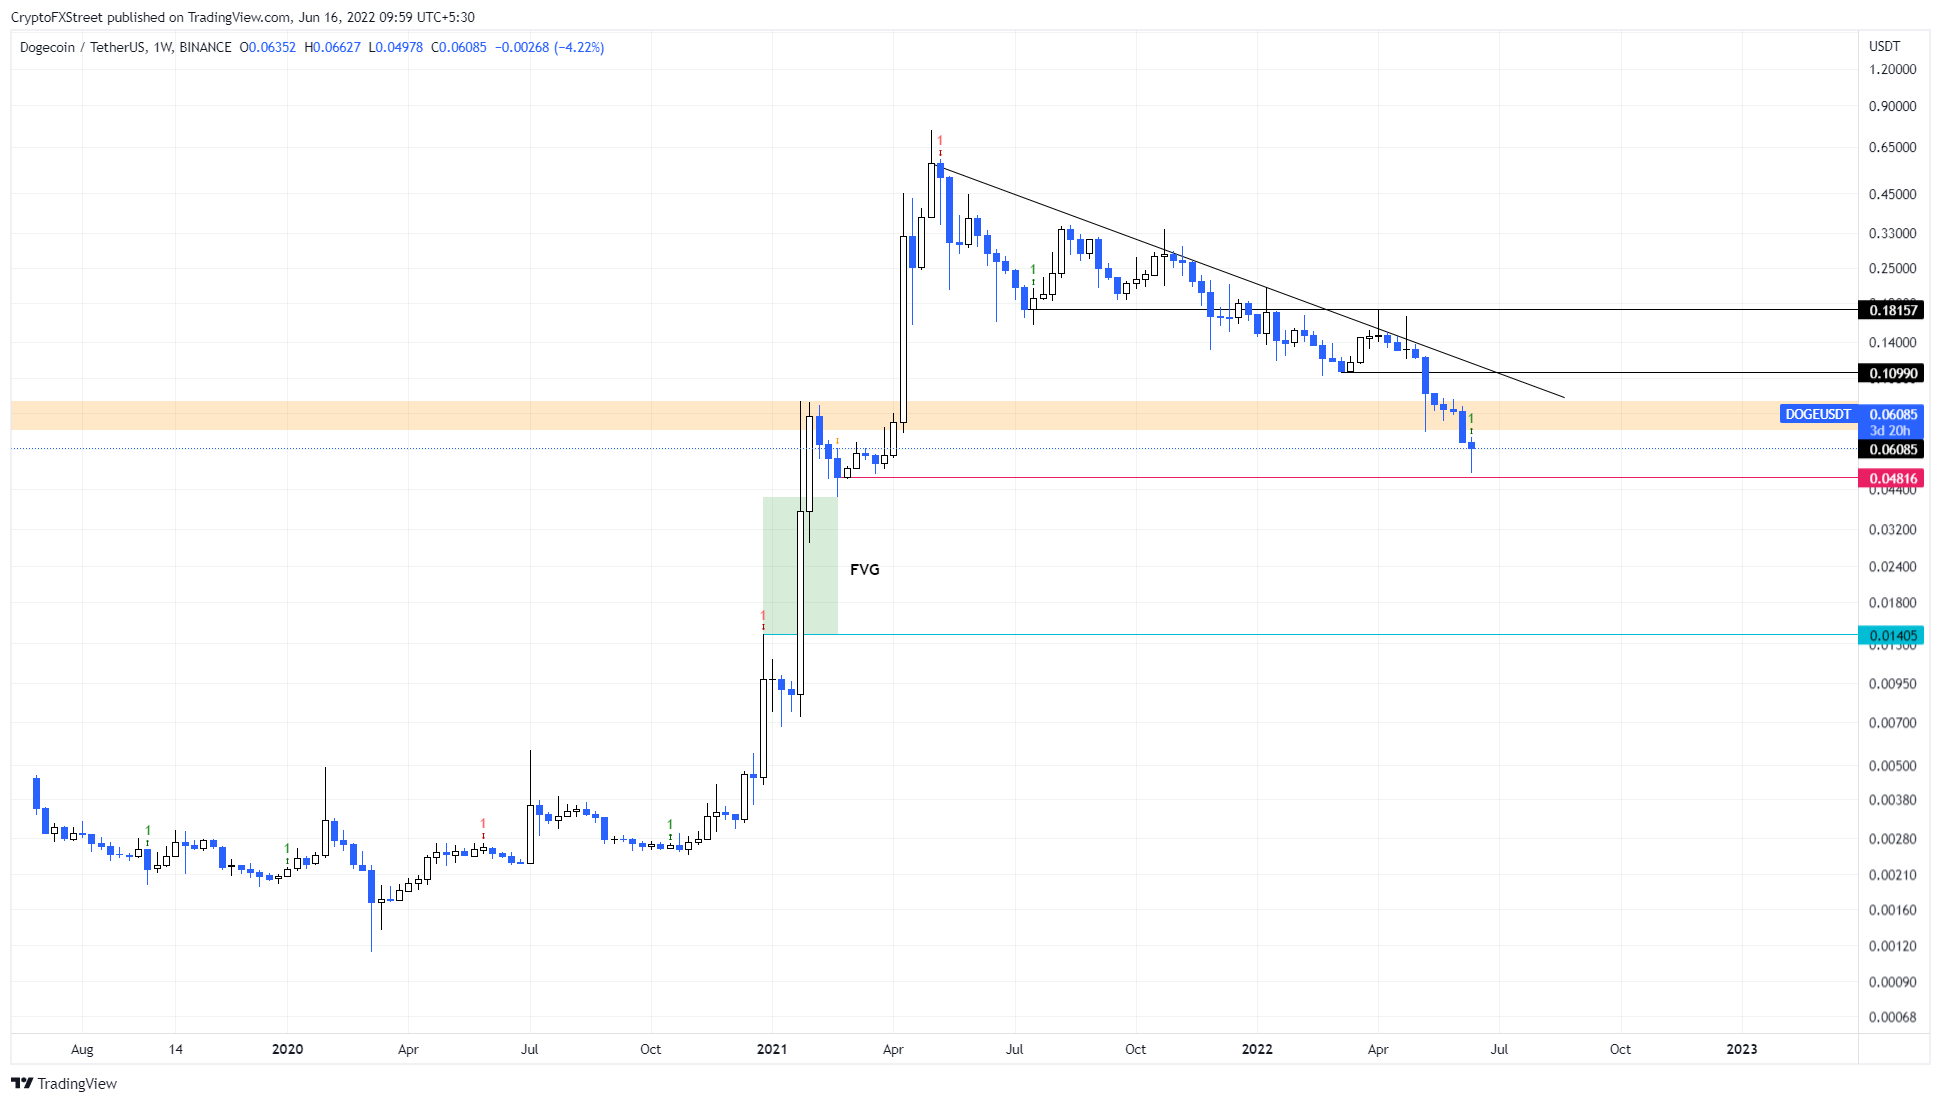
DOGE/USDT 1-week chart
On the other hand, if the Dogecoin price produces a weekly candlestick close below $0.048, it will create a lower low and signal the continuation of a downtrend.
Additionally, this move would also flip the said level into a resistance barrier and invalidate the bullish thesis and the MRI’s buy signal for DOGE. In such a case, Dogecoin price could crash 60% to fill the price inefficiency or Fair Value Gap (FVG), extending from $0.041 to $0.014.
Author

Akash Girimath
FXStreet
Akash Girimath is a Mechanical Engineer interested in the chaos of the financial markets. Trying to make sense of this convoluted yet fascinating space, he switched his engineering job to become a crypto reporter and analyst.



