- Aptos price dropped below the line in the sand after a firm rejection on Monday.
- APT is lagging together with other major cryptocurrencies on the promised breakout.
- Expect a bullish wave any day now as tail risks diminish.
Aptos (APT) price is set to rocket to the moon with a near 50% gain in its trace as bulls need to start buying into APT. The reason for this comes in the aftermath of the speech by President Putin in Russia that did not hold any specific clues and instead only dealt a pausing of the START treaty as revenge for US President Biden’s visit to Kyiv. Several analysts have pointed to plenty more risks and possible scenarios that have not materialized, which could bring big gains as the probability of tail risks has become significantly smaller.
Aptos price set to surge as tail risks evaporate
Aptos price is down near 4% this Tuesday during the European session as the promised bullish breakout that was poised to happen this week fails to emerge so far. This bearish impression must not fool traders as a big surge in buying activity could start to pick up after the speech from President Putin in Russia. Whereas several analysts feared that plenty of additional actions and counteractions would be triggered, only the START (Strategic Arms Reduction Treaty) program will be put on hold as retaliation for the delivery of tanks and more funding out of the West.
APT finds support near $13.52 and could be seen rising back toward $14.50 to try and break over the rejection from Monday. Once that happens, the bullish turnaround is established, and APT is set to continue its surge as the geopolitical tail risks have become less severe than first presumed by the markets. Although it might take weeks, $20 could be possible if geopolitical and macro tail risks keep decreasing at this pace.
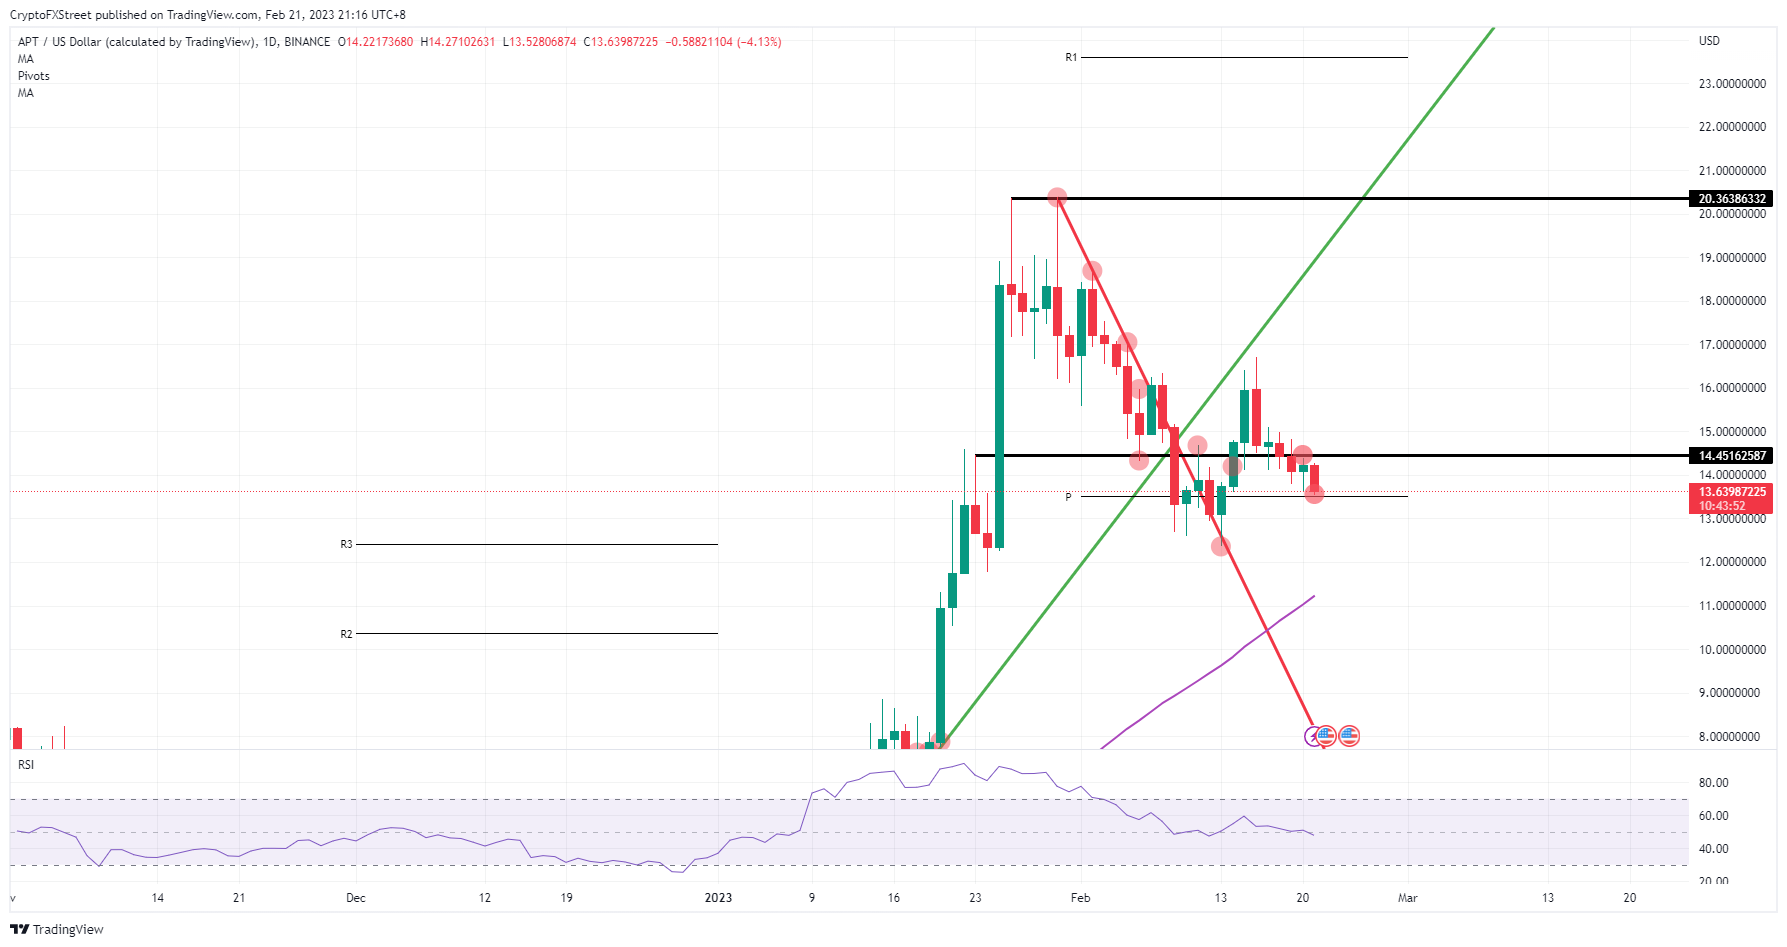
APT/USD daily chart
Should Russia have wrong-footed markets with its very soft speech and suddenly revert to unconventional weapons without warning, expect a nosedive move in APT. A break below the monthly pivot at $13.52 is inevitable. From there, the risk of a free fall is quite big. The best guess comes at $11 with the 55-day Simple Moving Average as the counterweight.
Information on these pages contains forward-looking statements that involve risks and uncertainties. Markets and instruments profiled on this page are for informational purposes only and should not in any way come across as a recommendation to buy or sell in these assets. You should do your own thorough research before making any investment decisions. FXStreet does not in any way guarantee that this information is free from mistakes, errors, or material misstatements. It also does not guarantee that this information is of a timely nature. Investing in Open Markets involves a great deal of risk, including the loss of all or a portion of your investment, as well as emotional distress. All risks, losses and costs associated with investing, including total loss of principal, are your responsibility. The views and opinions expressed in this article are those of the authors and do not necessarily reflect the official policy or position of FXStreet nor its advertisers. The author will not be held responsible for information that is found at the end of links posted on this page.
If not otherwise explicitly mentioned in the body of the article, at the time of writing, the author has no position in any stock mentioned in this article and no business relationship with any company mentioned. The author has not received compensation for writing this article, other than from FXStreet.
FXStreet and the author do not provide personalized recommendations. The author makes no representations as to the accuracy, completeness, or suitability of this information. FXStreet and the author will not be liable for any errors, omissions or any losses, injuries or damages arising from this information and its display or use. Errors and omissions excepted.
The author and FXStreet are not registered investment advisors and nothing in this article is intended to be investment advice.
Recommended Content
Editors’ Picks
Worldcoin Price Prediction: Is WLD done with uptrend after 77% rally?

Worldcoin has paused its uptrend as it currently trades at $1.57. This move comes after the altcoin rallied a whopping 77% in just three days, between September 13 and 16. As WLD hovers aimlessly, investors need to be patient to catch the next volatile move.
Ethereum whales prepare ahead of futures Ethereum ETF approval on October 2

Ethereum (ETH) price is likely going to witness a massive spike in volatility soon due to the circumstances surrounding the approval of the token’s futures Exchange-Traded Fund (ETF). According to Twitter users, the ETF is likely going to be approved on October 2.
Ripple Price Forecast: Declining network growth and underwater XRP holders suggest more downside for XRP price

Ripple (XRP) price shows a lack of buying pressure after its win against the US Securities and Exchange Commission (SEC) on July 13. Since then, the remittance token has been on a downtrend. Considering Ripple’s current position, a further decline would not be surprising.
Chainlink Price Prediction: LINK bears set to wipe 25% gains
-637336005550289133_XtraSmall.jpg)
Chainlink price shows an exhaustion of the bullish momentum as it approaches a key reversal zone. This development could see LINK trigger a steep correction that could undo recent gains.
Bitcoin: BTC downside likely after 20-week EMA culls bulls

Bitcoin (BTC) bearish price fractal, as discussed in a previous article, is underway, but the lack of volatility is causing ambiguity and doubt. Regardless, BTC might see a bit of an upside before the long-term bearish scenario plays out.