This buy signal for Bitcoin price hints the start of a new macro bull run, should you start buying dips?

With Bitcoin (BTC) price up 47% year-to-date, things are looking quite bullish after cascading collapse of major crypto players in 2022. So, this newsletter is focused on answering the questions that most retail investors are faced with right now:
- Is this a bull run?
- Should I buy crypto now?
To answer these questions, I will be taking a look at Bitcoin and a reliable signal that has consistently indicated the start of a bull run. I will take it a step further and determine which strategy is better – buy and hold, aka lumpsum investment, or buying the dips.
Disclaimer: This strategy is from a purely technical standpoint and does not take into account the on-chain metrics or other external factors like macroeconomics. This newsletter is NOT financial advice.
Is this Bitcoin bull run?
From a daily timeframe perspective, Bitcoin price seems to have put an end to its downtrend as it produced a higher high at $23,800 on January 30, relative to the November 5 swing high at $21,480.
Technically, a trend reversal is in progress, indicating that the narrative is flipping bullish, but additional confirmation is required. This signal will arrive if BTC produces a higher high above the last key swing high formed on August 15 at $25,211 and manages to stay above the $20,000 psychological level.
Also read: Bitcoin whales are buying the dip despite sell signals, and it makes sense
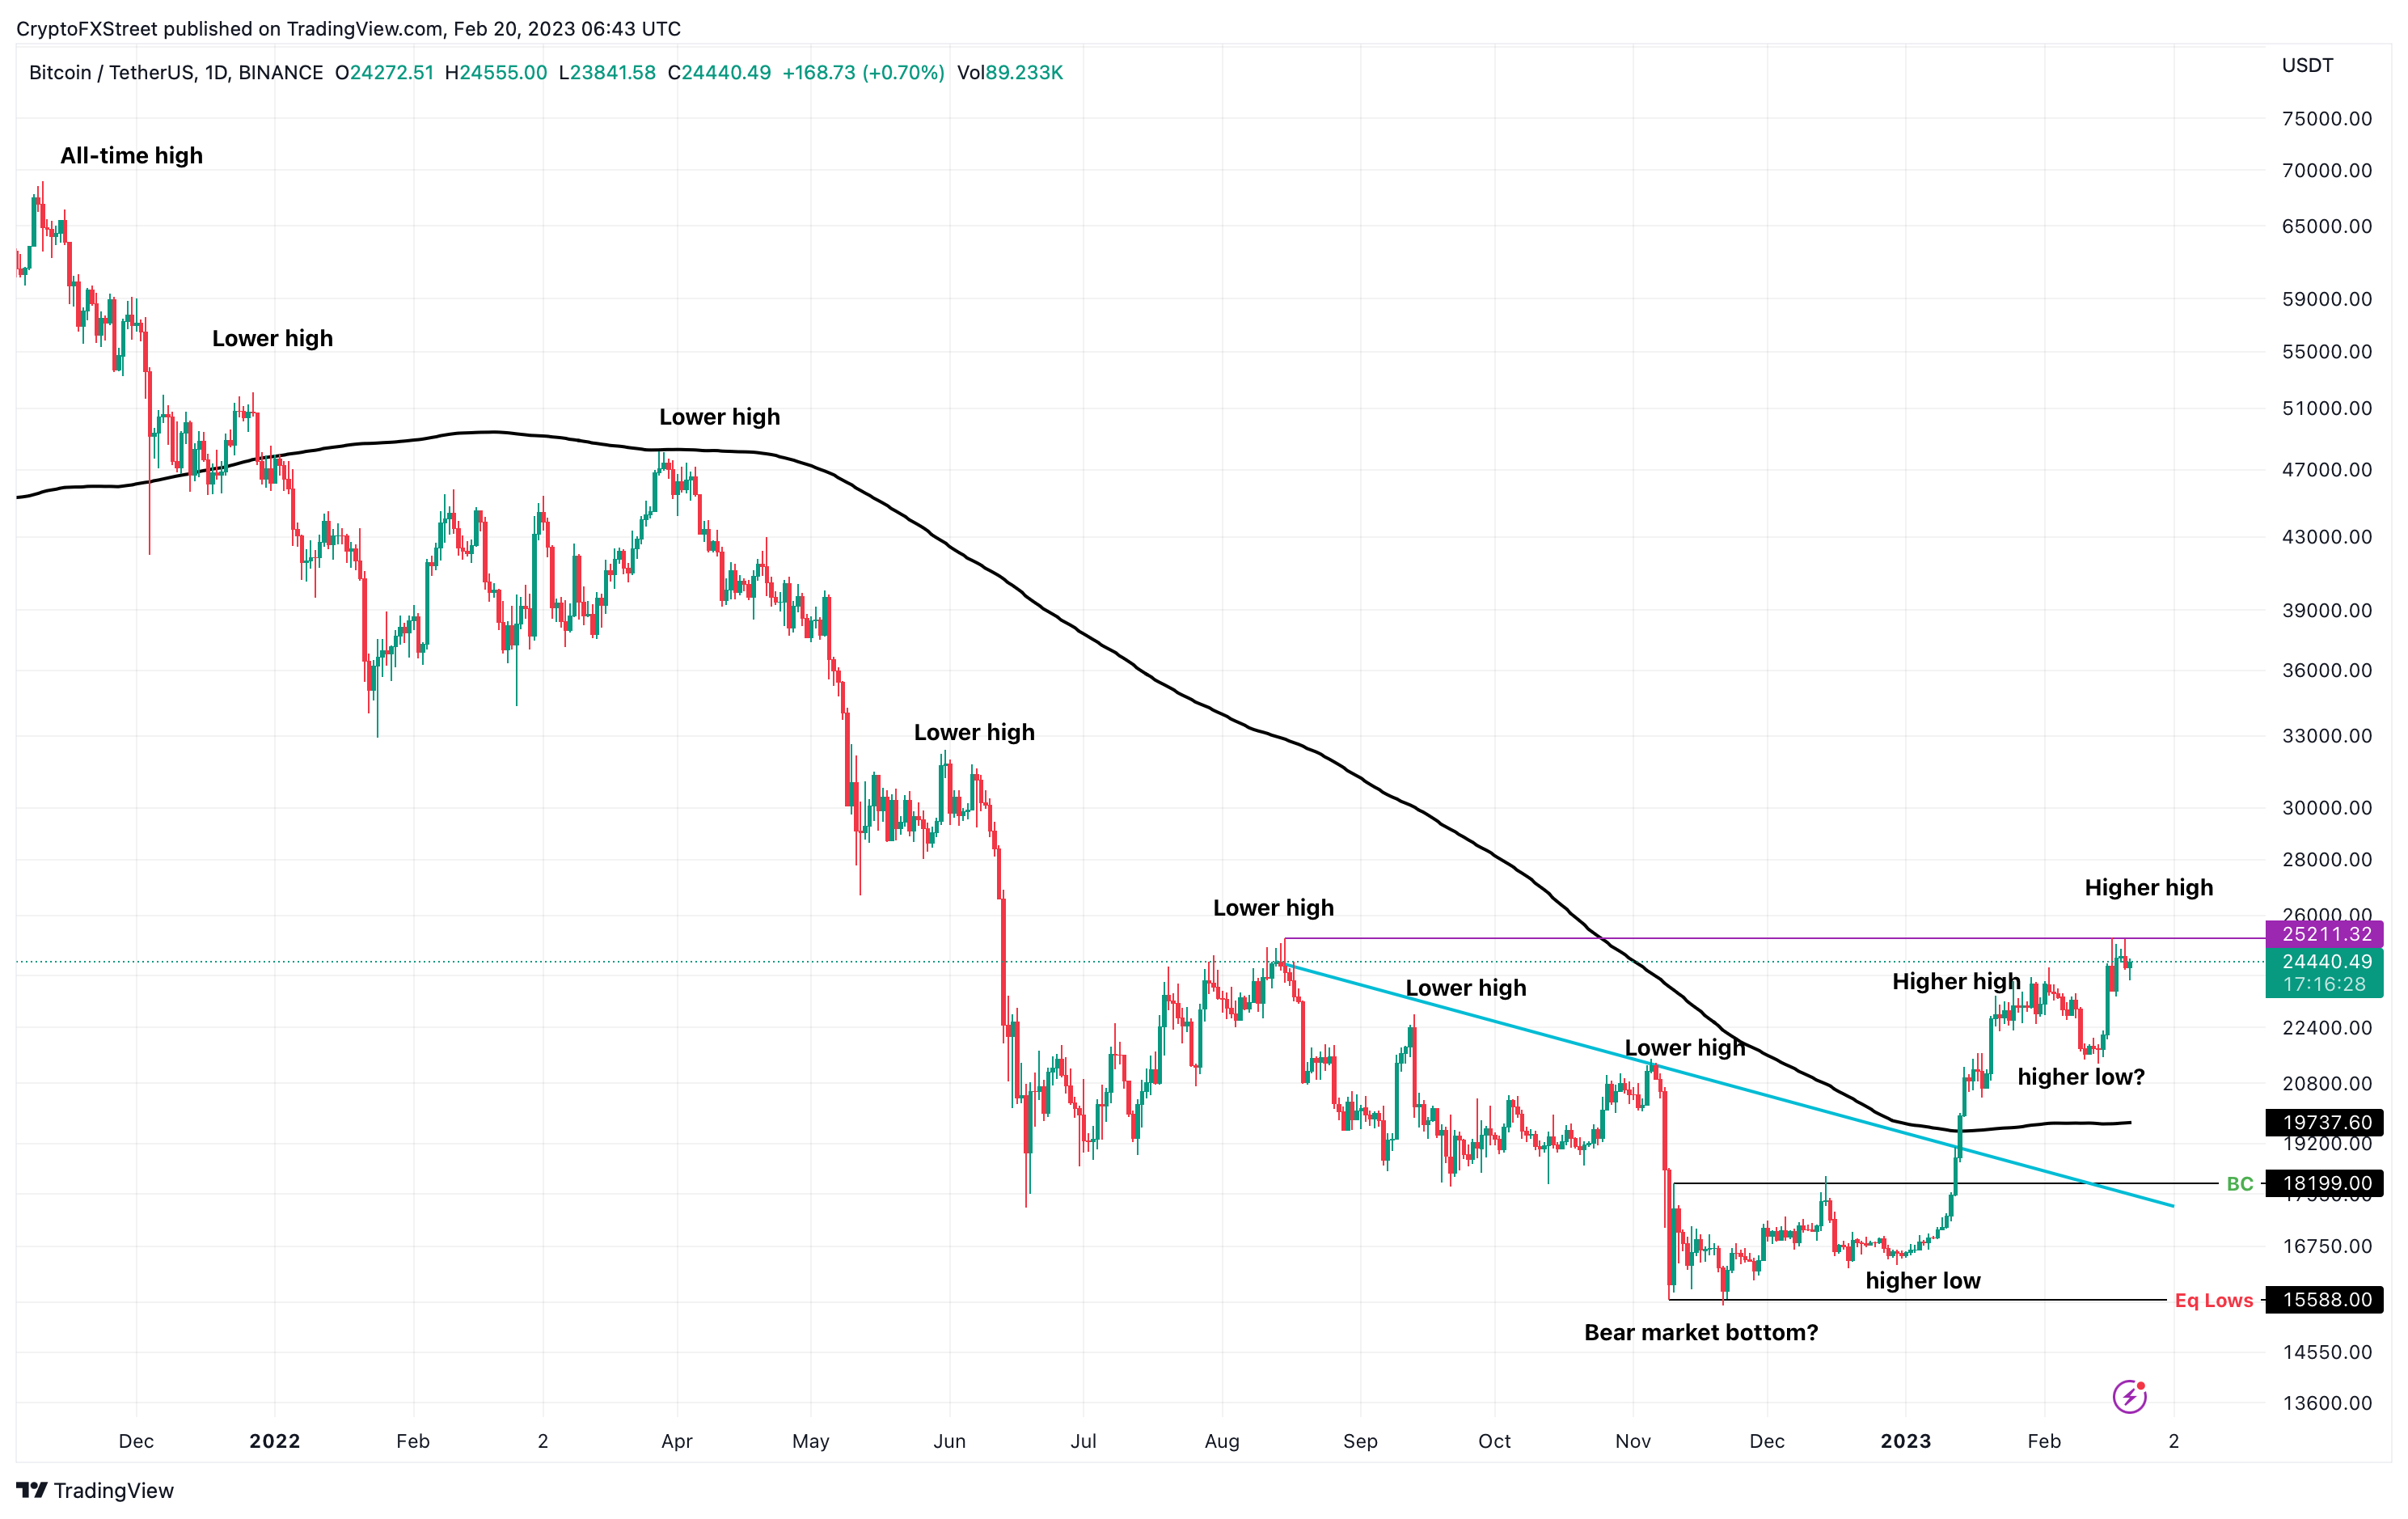
BTC/USD 1-day chart
Understanding the strategy
The strategy utilizes two popular momentum indicators, Relative Strength Index (RSI) and the Awesome Oscillator (AO), for Bitcoin price on the weekly timeframe. The main condition that produces a buy signal is RSI needs to be above 50, and AO needs to be positive or above the zero-line.
Since 2012, these conditions have produced five buy signals. The one on July 6, 2015, was a false positive, where the RSI slipped below 50 briefly.
The Pi Cycle top indicator available on TradingView is used to determine Bitcoin bull run tops or sell signals accurately. The following table shows the performance of Bitcoin price based on this strategy.
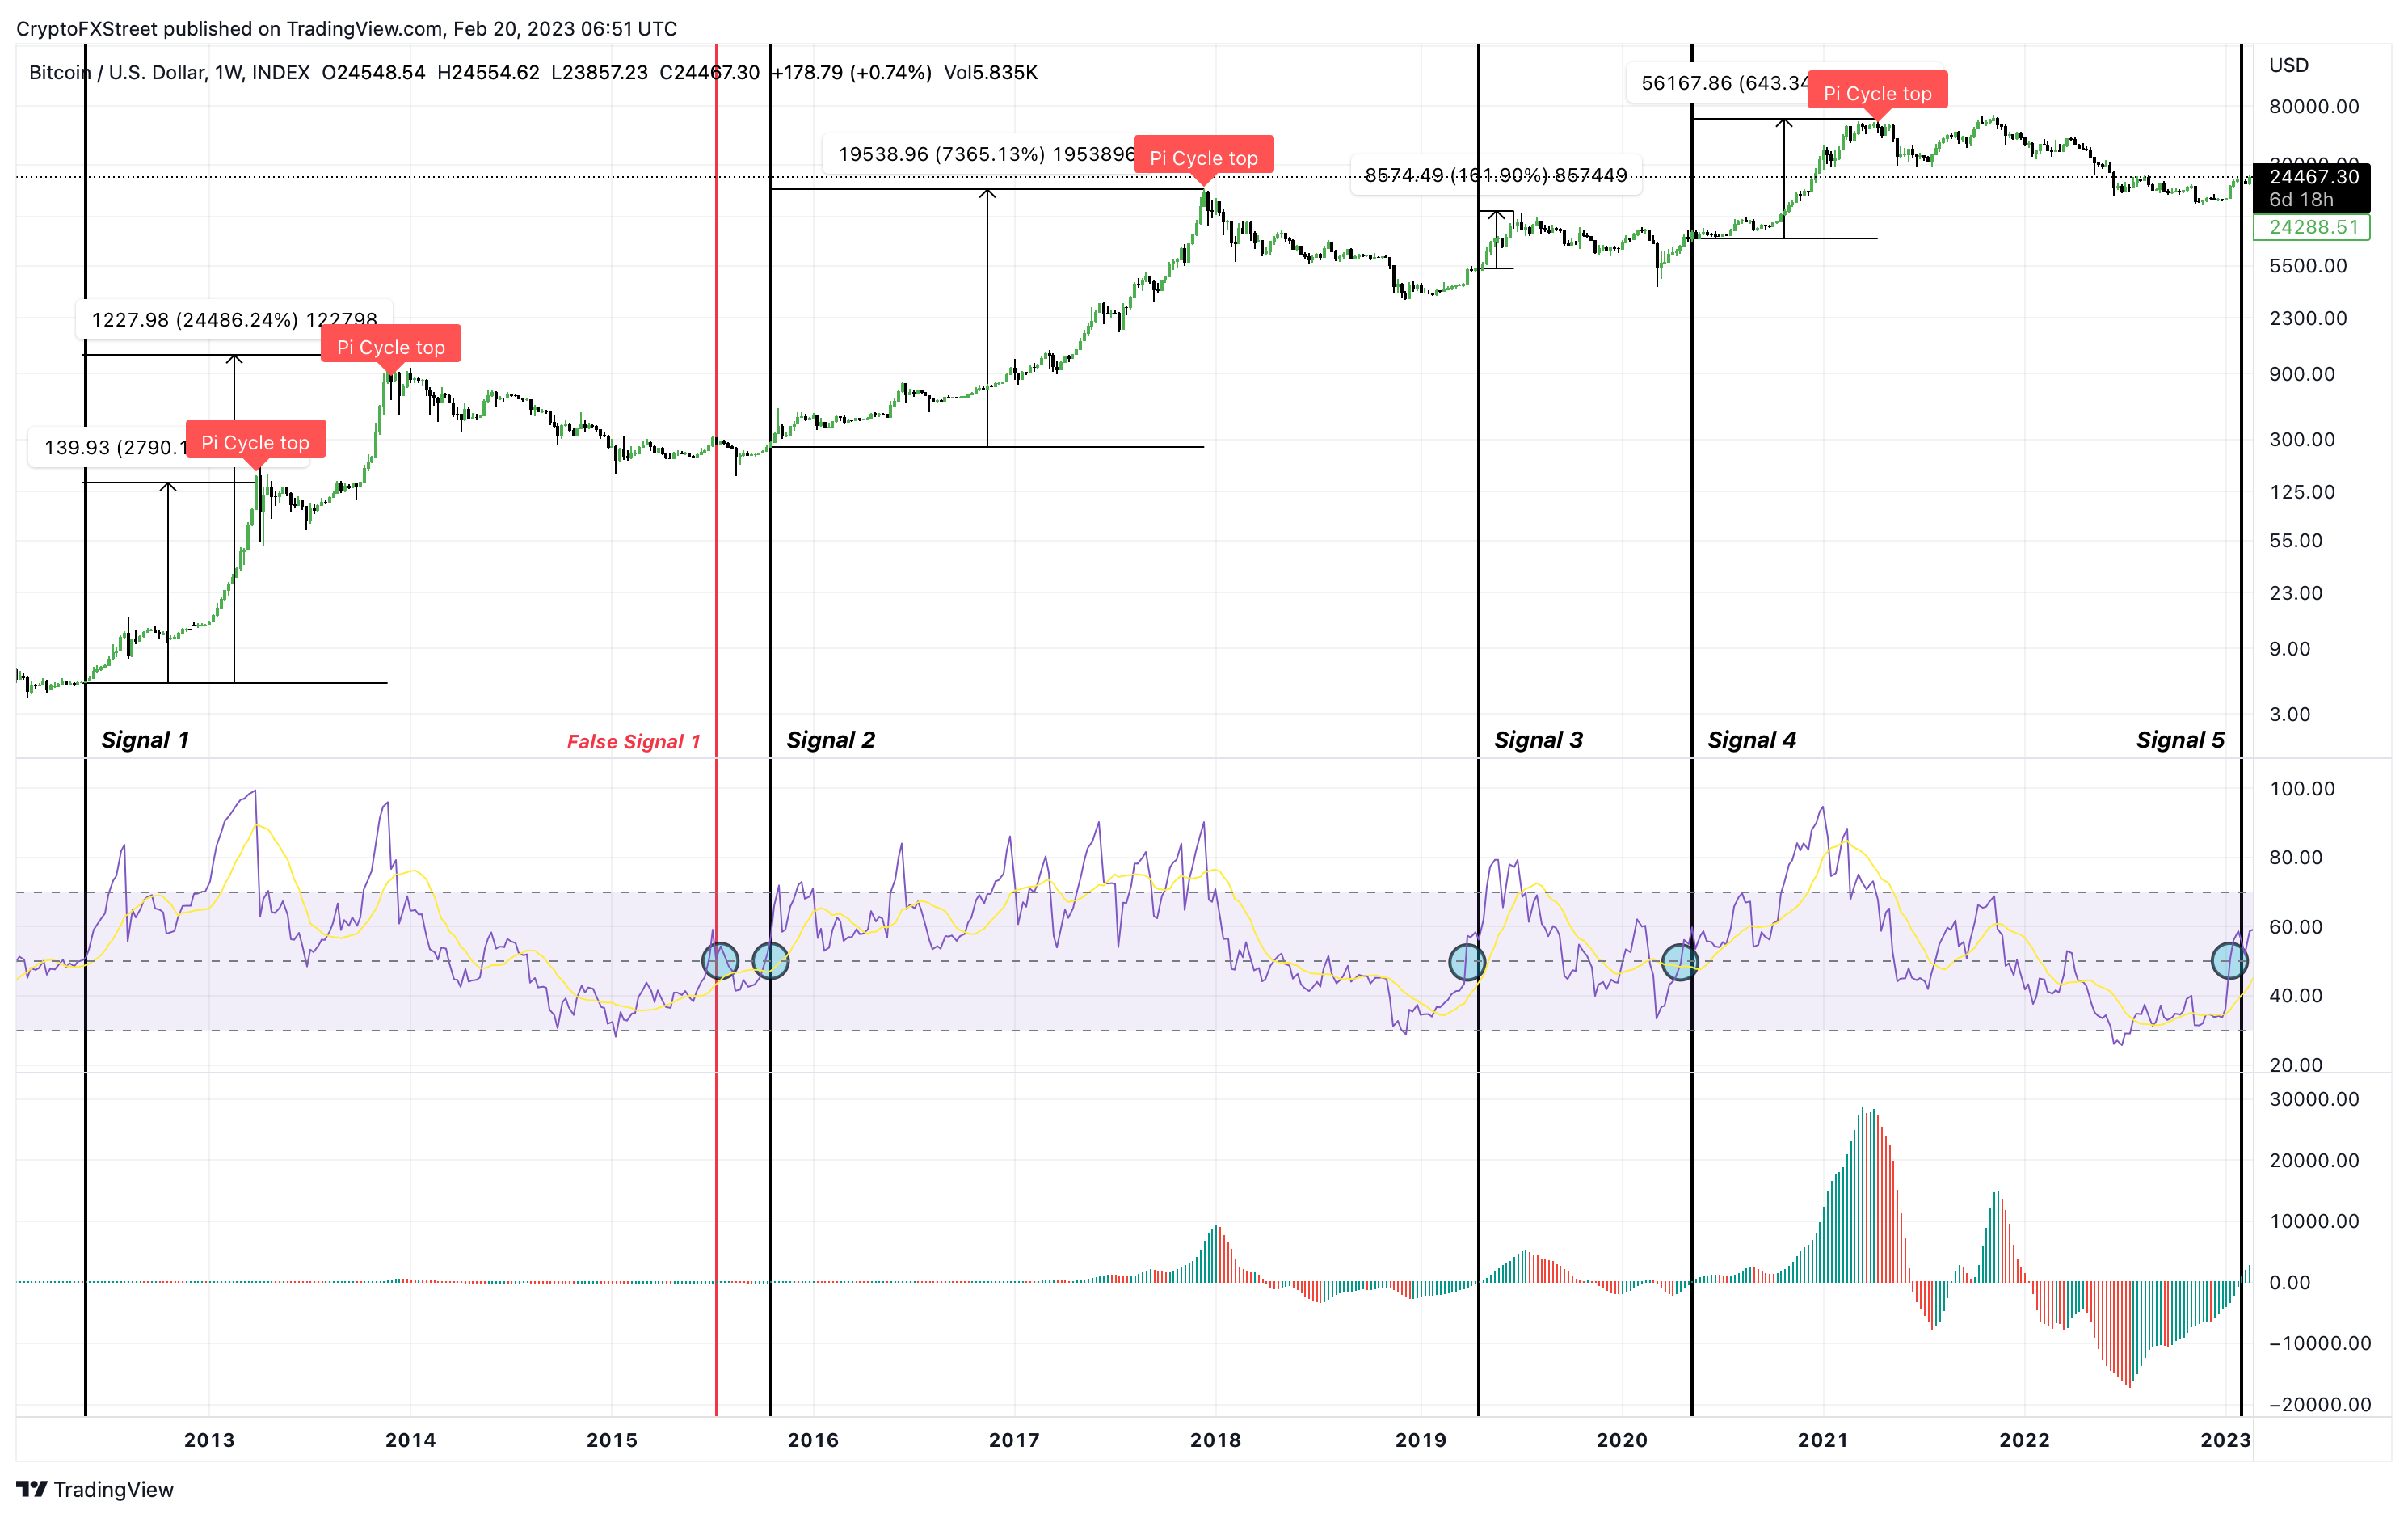
BTC/USD 1-week chart
The first buy signal was on May 28, but the Pi Cycle top indicator produced two sell signals; one on April 1, 2013, and the other on December 2, 2013. Hence, there are two profit percentage values in the table below.
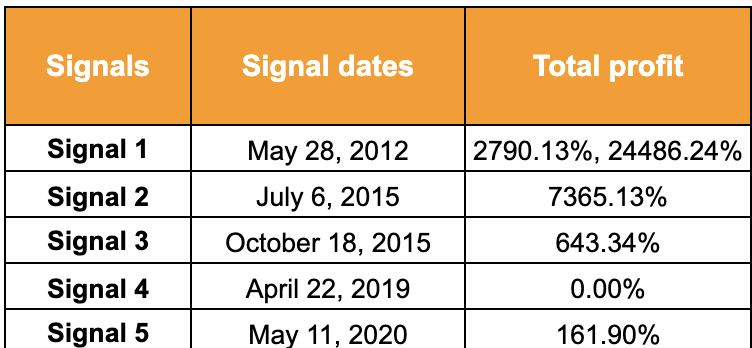
In hindsight, the buy signal has proved to be extremely reliable and flashed the sixth buy signal on January 30, 2023. Since this point, BTC is up 3.10% and is at the time of writing trading at $24,486. The returns seen in the table are self-explanatory, but considering the macro conditions, investors can opt relatively risk-averse strategy based on these buy signals.
Buy-the-dip
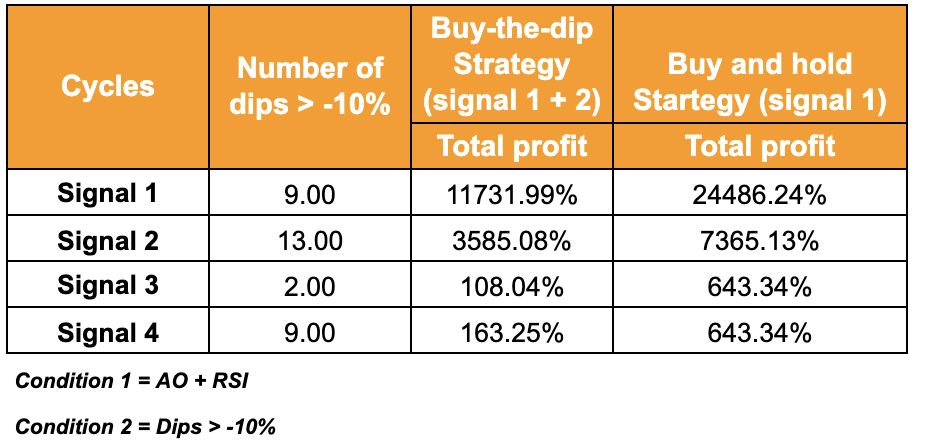
Instead of lumpsum investment BTC after the first buy signal, market participants can choose to deploy their capital in equal chunks when Bitcoin price retraces during its bull run. The only advantage this strategy has is that if the signal were to be a false positive, it would allow buyers to get out or double down on their decision, depending on the nature of the false positive signal.
After the main buy conditions are met, interested participants can choose to buy dips that are greater than -10%. After the first buy signal, Bitcoin price there were nine dips greater than -10%, indicating nine buying opportunities for investors.
The second buy signal had 13 dips. Signals three and four saw two and nine dips, respectively. The table attached below shows a comparison of returns if investors stuck to the lumpsum strategy vs. if they bought the dips.
Should you start investing now?
The simple answer is yes. A rather complicated way of looking at this topic would involve paying close attention to the macroeconomic conditions and Bitcoin’s historical cycles to determine if the current buy signal will lead to a bull run.
The macroeconomic outlook seems to be improving due to disinflation. But if the economy deviates from its current path, it would prompt the United States Federal Reserve to veer off its course and implement stringent plans to reduce inflation. Such a move could probably break the system and trigger a big recession.
Bitcoin price has spent roughly 462 days in a bear market and has shed nearly 77% from its all-time high of $69,000. From a historical standpoint, a further pullback to $10,000 would not be surprising to many long-term investors, but the question of whether it will occur is yet to be answered.
Due to all these uncertainties, pragmatism is the best approach. Retail investors, especially millennials, generally do not have a lot of money saved. Hence, participants like these are better
Author

Akash Girimath
FXStreet
Akash Girimath is a Mechanical Engineer interested in the chaos of the financial markets. Trying to make sense of this convoluted yet fascinating space, he switched his engineering job to become a crypto reporter and analyst.


