Buy pressure ‘in bull market territory’ – Five things to know in Bitcoin this week
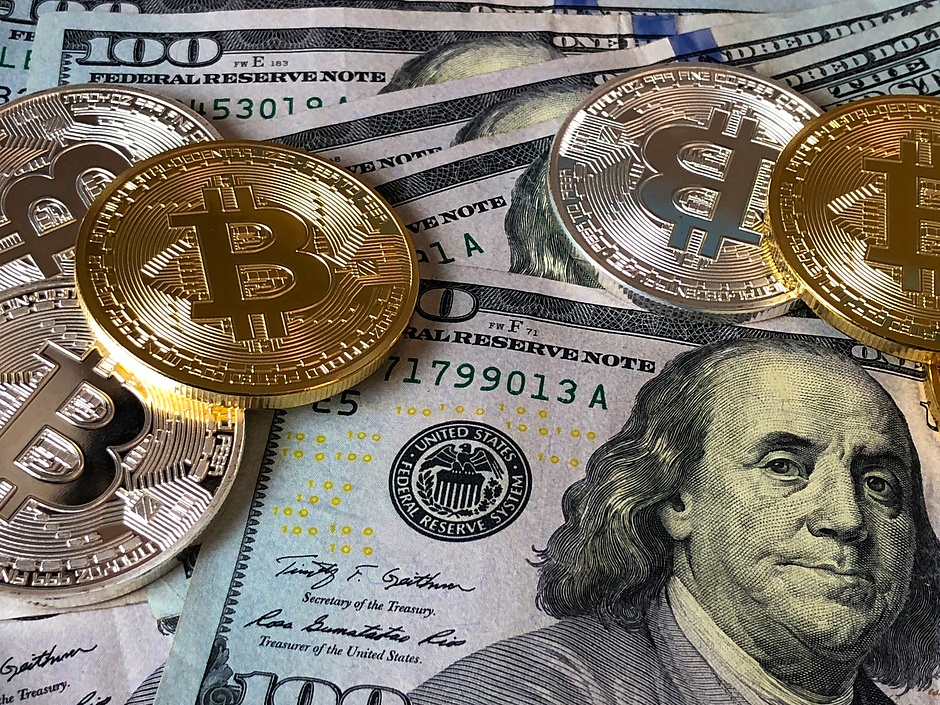
Bitcoin (BTC) begins the last week of March with a bang after returning to its yearly opening price above $46,000.
In a surprisingly strong upward move for a weekend, BTC/USD began surging upwards Saturday, continuing overnight to challenge its highs from the start of 2022.
Coming against an ongoing macroclimate of considerable uncertainty, strength in Bitcoin is naturally being taken with a pinch of salt this month. The reaction is understandable given that previous attempts to break out of its multi-month trading range have all ended in failure.
Despite volatile periods, bulls were always left disappointed and Bitcoin subsequently not only reversed but often revisited the lower end of its range, costing both short and long positions dearly.
Nonetheless, the hope is that this time really will be different — analysts had long argued that only a breakout above the range ceiling, formed by the yearly open around $46,200, would be enough to cause a paradigm shift.
Now that this is in action on the charts, attention is focusing on the final hurdle — cementing these multi-month resistance levels as support.
With the process ongoing Monday, Cointelegraph takes a look at potential triggers that could make or break this important episode in Bitcoin price action.
Bitcoin wipes out the 2022 dip
“Gradually then suddenly,” or pure chance? Traders are still trying to make sense of Bitcoin’s newfound strength this week.
It’s been a sight absent from the chart since the New Year — BTC/USD is back at $47,000. After jumping almost $3,000 in 24 hours, the largest cryptocurrency dealt a firm blow to resistance levels that had kept bulls firmly in their place for months.
The significance of $46,000 has been a hot topic for almost as long — a return to the yearly open, many said, would be the signal that Bitcoin was ready for bigger things once more.
Few would have thought that the phenomenon would play out “out of hours,” however. Suspicions over the rally’s real strength are naturally pervasive on social media as the week gets underway, just as they were as the rally itself began.
Nonetheless, even the more cautious voices are no longer discounting the potential for further upside, even if the longer-term prognosis remains downhill.
“Fundamental buying pressure for Bitcoin has now climbed into bull market territory,” analyst and statistician Willy Woo reported.
Fellow analyst Matthew Hyland, a key supporter of the $46,000 argument, gave a target of $52,000 as the next long-term resistance wall to crack.
In Twitter posts, he added that the move was preceded by a breakout on Bitcoin’s relative strength index (RSI) indicator, a classic signal of breakout trends.
RSI assesses how overbought or oversold an asset is at a specific price. In the case of Bitcoin, its score has been climbing off a floor level since mid-January, data from Cointelegraph Markets Pro and TradingView shows.
Further development of RSI, therefore, could dictate the extent of the rally, as per historical behavioral norms.
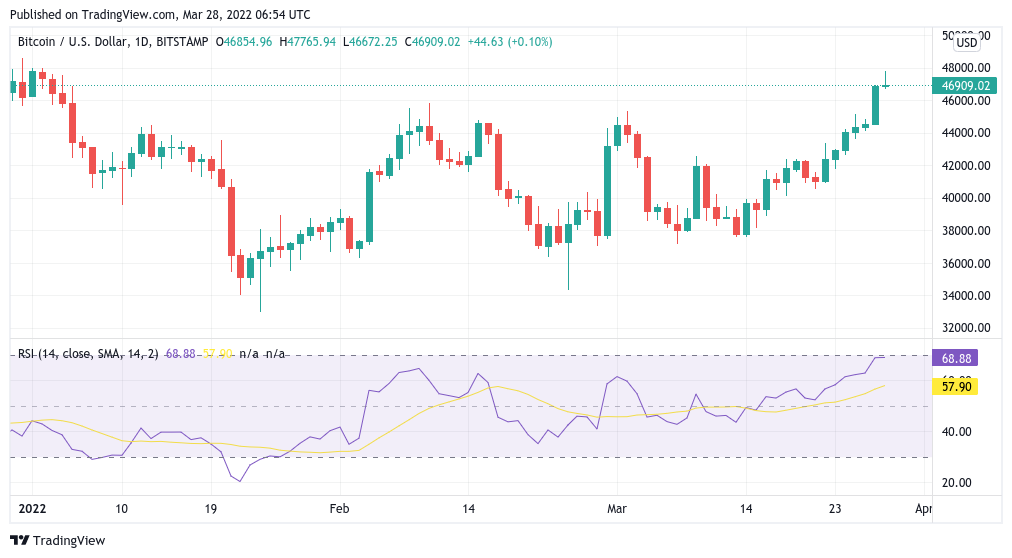
BTC/USD 1-day candle chart (Bitstamp) with RSI data. Source: TradingView
Analyst eyes Bitcoin stocks decoupling
It’s a confusing world out there, and when it comes to how Bitcoin should be acting, the picture does not get any easier.
Inflation, war in Europe and the persistent threat of Coronavirus returning — to name just three major macro triggers — have had commentators forecasting doom and gloom for stocks and risk assets alike in 2022.
Just this month, multiple sources warned that Bitcoin could soon face its Waterloo as a dramatic stocks capitulation sparks another March 2020 moment.
The “easy money” age which followed that event is gone, and only a continuation of quantitative easing would bring back the huge capital flows Bitcoin enjoyed later that year, some argued.
Now, however, Bitcoin appears to be striking out on its own, challenging an intense stock market correlation which in the case of the S&P 500 reached a 17-month high last week.
While the S&P has shaken off the impact of the Russia-Ukraine war and plans for tightening by the United States Federal Reserve, analysis shows that selling has been considerable and shorts are everywhere — the perfect fuel, ironically enough, for a fresh “short squeeze” upwards.
“Risk-on/Risk-off correlations to equities is a short term effect. BTC trades this correlation due to short term speculators,” Woo explained in a recent dedicated Twitter thread on the topic.
“Bitcoin‘s internal demand fundamentals powered by its adoption curve is more powerful. Eventually the market decouples; the last time was Oct 2020.”
Should speculators have been ruling the roost so far this year, then a return of interest in Bitcoin futures could be a trigger to watch going forward. Open interest in Bitcoin futures is now at its highest since December, data from Coinglass shows.
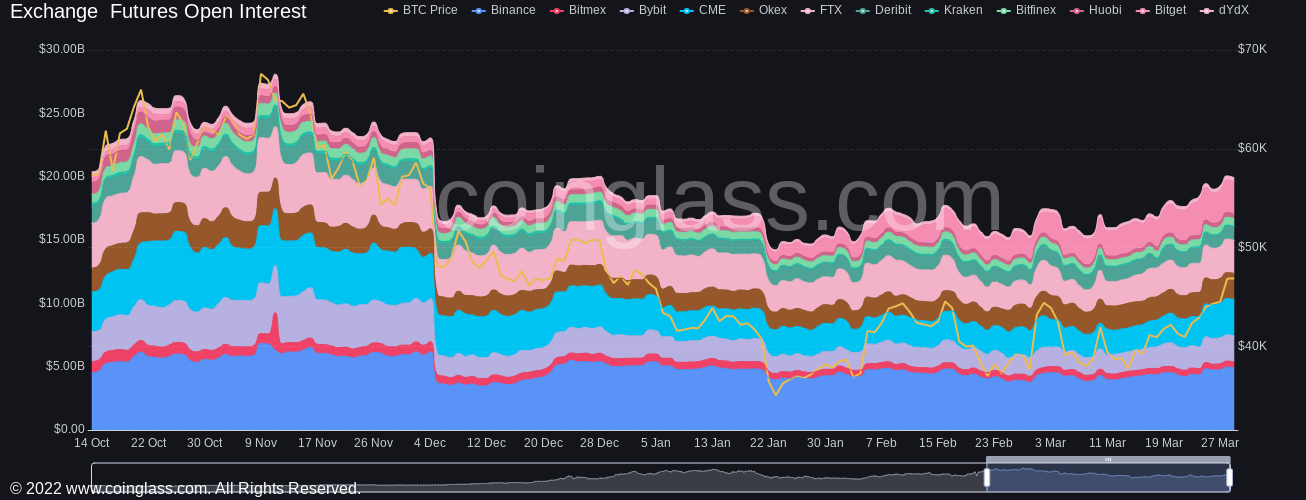
Bitcoin futures open interest chart. Source: Coinglass
Who wants their money back?
There is another side to the $46,000 story, making it more than just a symbolic level from the New Year.
As noted by on-chain analytics firm Glassnode this weekend, the area around $45,900 is one with a giant amount of prior buyer activity.
Market entrants bought in on the way down from all-time highs and have been underwater since, thanks to it providing the ceiling for Bitcoin’s 2022 trading range.
A return, Glassnode warned, may ruin the mood as a rush for the exit from those buyers plays out.
“The next major on-chain resistance for Bitcoin is the Short-Term Holder Realized Price, trading at $45.9k. This metric is the average price paid for BTC by investors who purchased after the October ATH,” it explained on March 25 alongside a chart of its long- and short-term holder realized cap indicator.
“Bearish resistance comes from STHs seeking to ‘get their money back.’”
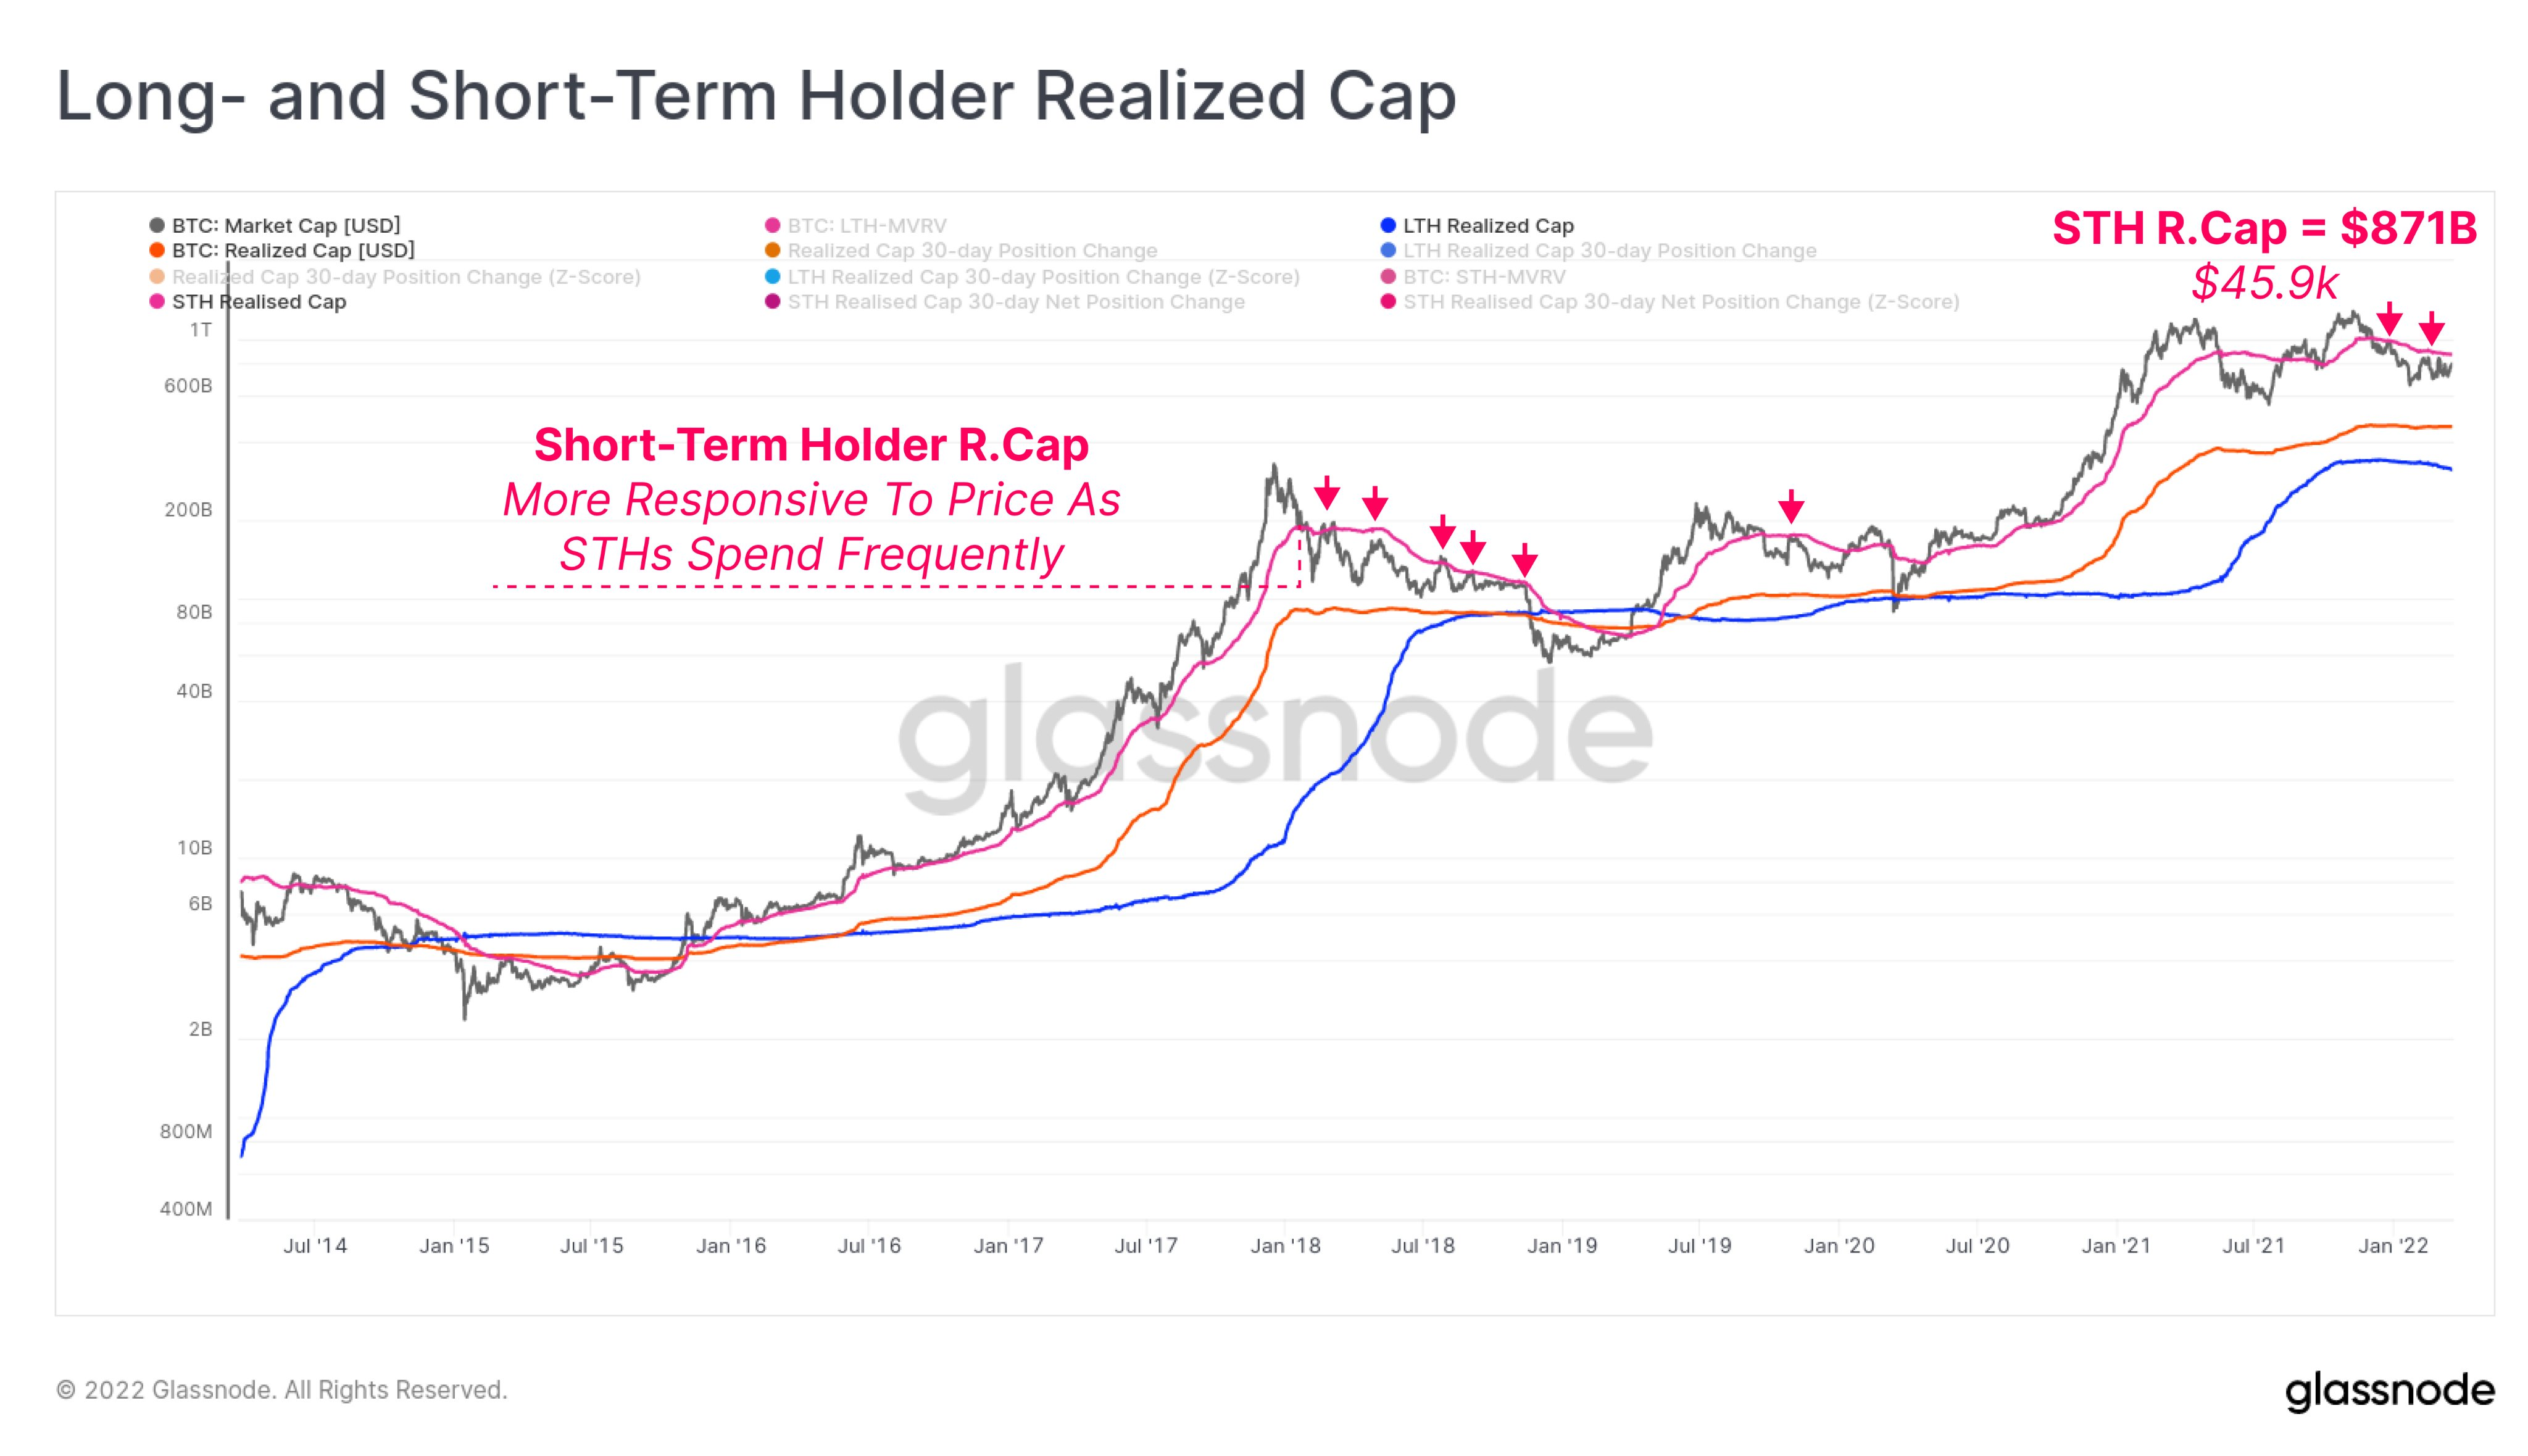
Bitcoin long- and short-term holder realized cap chart. Source: Glassnode/ Twitter
So far, short-term holders — defined as entities holding coins for 155 days or less — have not triggered a reversal of direction. The start of Wall Street trading, however, could still produce surprises.
Difficulty should see a new all-time high in days
Bitcoin’s network fundamentals are certainly determined not to disappoint this year.
The coming week will be no exception, as Bitcoin’s network difficulty climbs to new record highs of approximately 28.67 trillion.
The move will follow a month of losses, which, as Cointelegraph recently reported, accompanied the results of upheaval for miners operating in Kazakhstan.
Difficulty’s next automated readjustment, however, will not only cancel out those losses but add 4.4% to the existing tally, making difficulty greater than ever before.
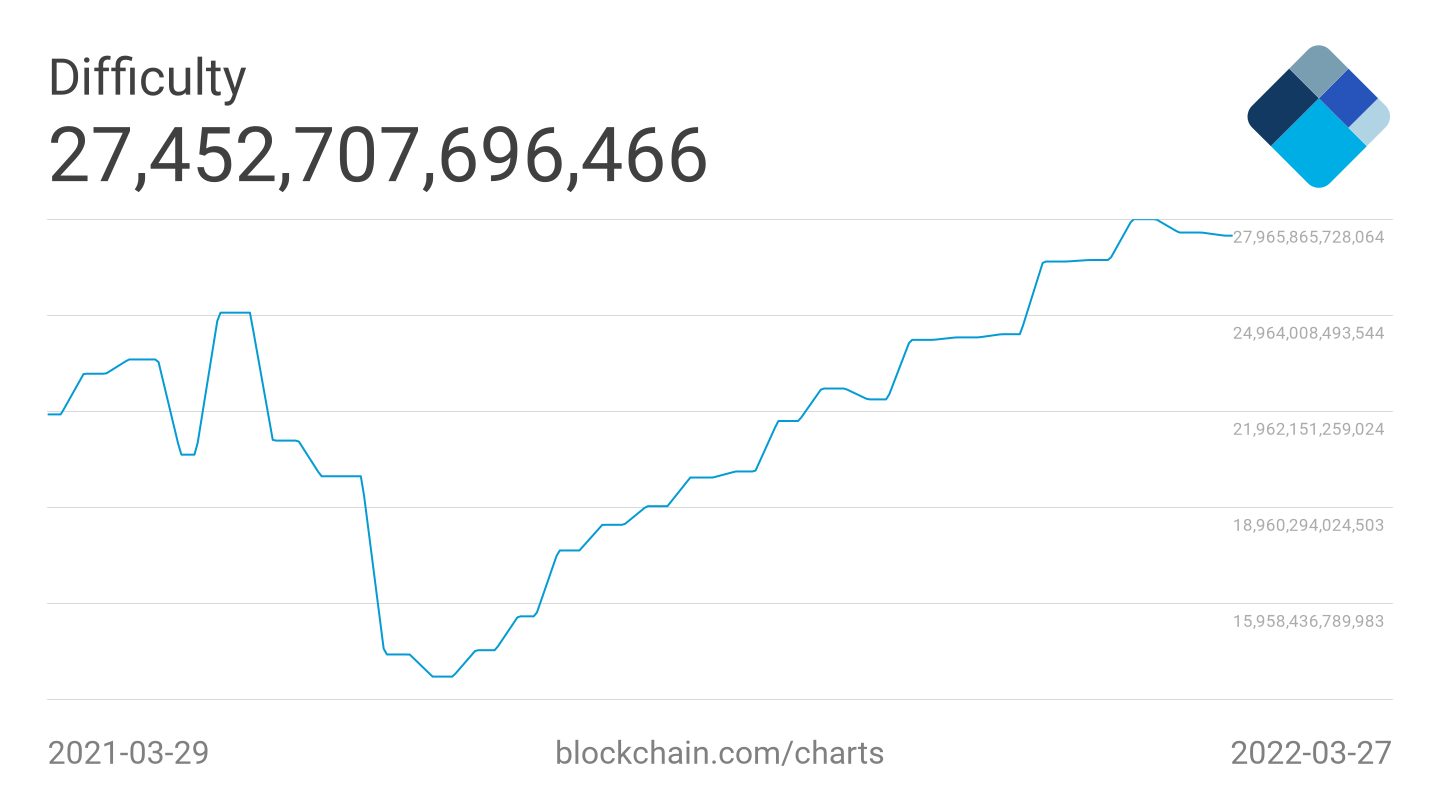
Bitcoin difficulty 7-day average chart. Source: Blockchain
The implication of increasing difficulty is essentially that mining for block subsidies has never been more competitive, as evidenced by Bitcoin’s equally bullish hash rate data.
In turn, Bitcoin becomes more resistant to network attacks as an increasing miner presence dedicates more and more resources to competing for the same fixed reward — and thus protecting network participants in the process.
Last year’s 50% hash rate drop, sparked by a crackdown in China which was previously the world’s mining stronghold, now seems nothing more than a distant memory.
An attempt to ban proof-of-work (PoW) cryptocurrency support in the European Union, meanwhile, failed to gain the support of lawmakers for a second time last week.
Hash rate provided by known mining pools sat at around 219 exahashes per second (EH/s), according to data from monitoring resource MiningPoolStats, itself the highest level ever recorded.
Greed is back for the first time since $60,000
Bearish at the bottom and bullish at resistance — it’s a classic market sentiment feature which plays out time and time again.
For the first time in 2022, however, the Crypto Fear & Greed Index has laid out just how exuberant the average crypto investor is feeling.
For the first time since just after Bitcoin’s most recent all-time highs of $69,000 in November, the classic sentiment indicator has entered “Greed” territory.
Its transformation, like sentiment itself this month, has been impressive. Just a week ago, it measured the mood as a normalized score of 22/100 — not just “fear,” but “extreme fear.”
Now, it is hot on the way to show the opposite, and as long-term investors know, sustained rallies tend only to come alongside gradual increases in sentiment.
Some of them, however, remain clearly excited to see what happens next.
“The crypto markets on a steady uptrend while the supply shock kicks in. It will only take one bullish event to send this back to all-time highs,” JRNY Crypto argued on March 27.
“Watch how crazy things get when the sentiment goes from fear to greed while supply is limited.”
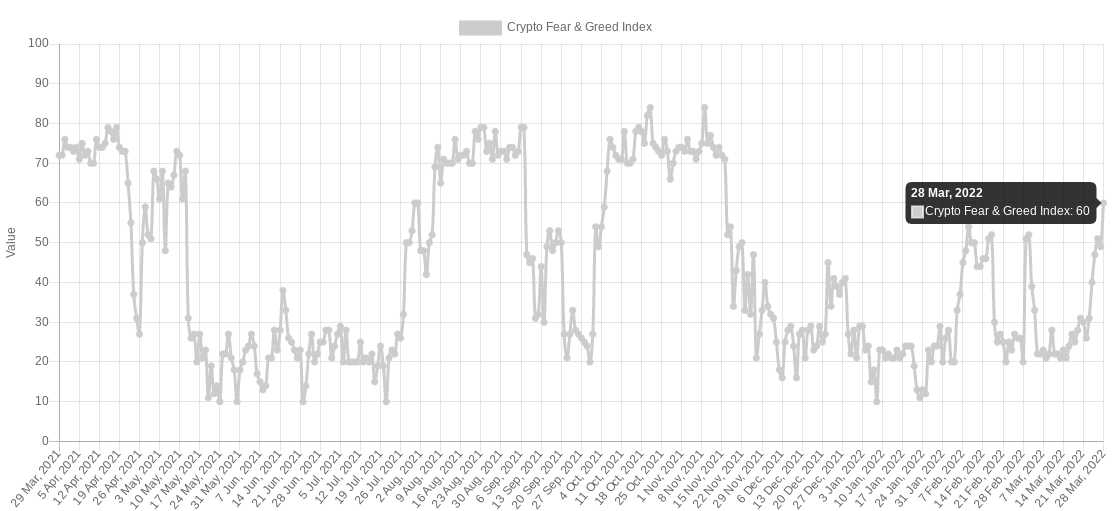
Crypto Fear & Greed Index (screenshot). Source: Alternative.me
Author

Cointelegraph Team
Cointelegraph
We are privileged enough to work with the best and brightest in Bitcoin.


