|

BTC/USD technical analysis shows buy signal

  • Technical analysis of BTC/USD shows that the market is giving a buy signal.
  • Bulls need to push the market above $3,500 to establish an upward trend.

BTC/USD daily graph

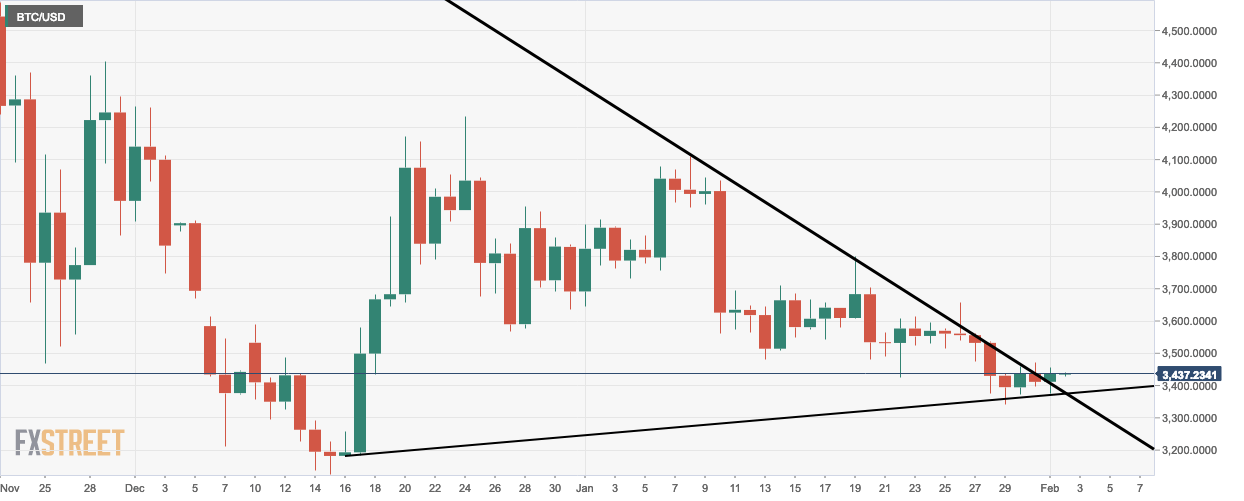
  • BTC/USD daily graph charts a triangle pattern from which the market does a bullish breakout.

BTC/USD hourly graph

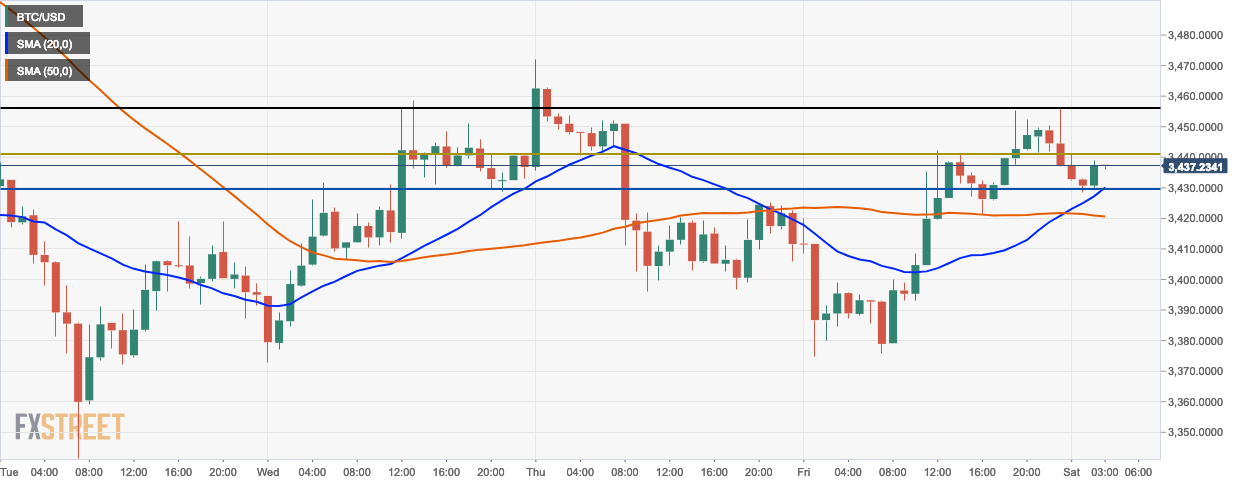
  • BTC/USD to test the $3,440 resistance line while jumping off the $3,430 support line.
  • 20-day simple moving average (SMA 20) crosses over with SMA 50 to indicate a buy signal.

BTC/USD 4-hour graph

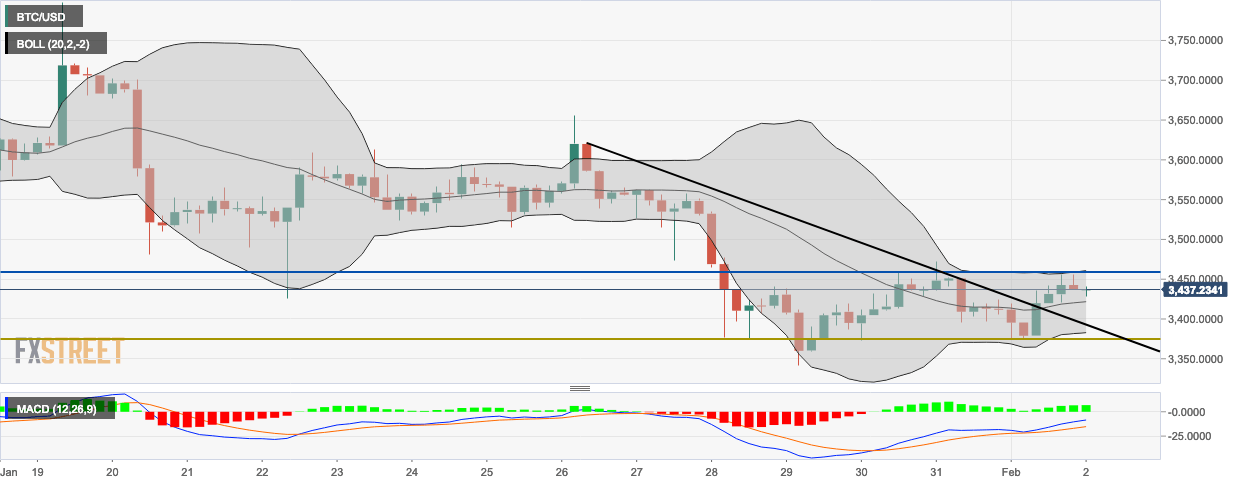
  • BTC/USD 4-hour graph trending above the SMA 20 curve to indicate a bullish market.
  • The last candlestick is below the upper curve of the 20-day Bollinger band, which shows that the market isn’t as bullish as it should be.
  • The moving average convergence/divergence (MACD) doesn’t indicate a proper momentum reversal.

Key Levels

  • Resistance 3: $3,552.09
  • Resistance 2: $3,504.10
  • Resistance 1: $3,470.66
  • Pivot Point: $3,422.67
  • Support 1: $3,389.22
  • Support 2: $3,341.23
  • Support 3: $3,307.78

Author

More from FXStreet Team
Share:

Editor's Picks

Ripple Price Forecast: XRP potential bottom could be in sight

Ripple edges up above the intraday low of $1.35 at the time of writing on Friday amid mixed price actions across the crypto market. The remittance token failed to hold support at $1.40 the previous day, reflecting risk-off sentiment amid a decline in retail and institutional sentiment. 

Crypto Today: Bitcoin, Ethereum, XRP in choppy price action, weighed down by falling institutional interest 

Bitcoin holds above support at $65,118 at the time of writing on Friday. Ethereum remains choppy in a narrow range between support at $1,900 and resistance at $2,000, while Ripple attempts another upward move toward the pivotal $1.40 level.

PancakeSwap Price Analysis: Bearish momentum suggests further downside

PancakeSwap (CAKE) is trading below $1.26 at the time of writing on Friday, extending the losses by over 8% so far this week. The weakening derivatives market further supports the bearish outlook, with bears aiming for levels below $1.18.

Decred Price Forecast: DCR rebounds toward key resistance zone on volume spike

Decred (DCR) rebounds over 7% at press time on Friday after a three-day decline of almost 14%. Roughly 60% increase in trading volume over the last 24 hours supports the recovery, suggesting heightened spot-market demand. 

Bitcoin Price Annual Forecast: BTC holds long-term bullish structure heading into 2026

Bitcoin (BTC) is wrapping up 2025 as one of its most eventful years, defined by unprecedented institutional participation, major regulatory developments, and extreme price volatility.

Bitcoin: BTC bears aren’t done yet

Bitcoin (BTC) price slips below $67,000 at the time of writing on Friday, remaining under pressure and extending losses of nearly 5% so far this week.