BTC/USD Technical Analysis: Five-week-old falling trendline guards upside beyond 50-day SMA
- Break of 50-day SMA triggers the BTC/USD pair’s run-up to strongest in a fortnight.
- A confluence of 100-day SMA, 38.2% Fibonacci retracement can question upside breakout.
- The short-term rising support line will be a challenge for sellers.

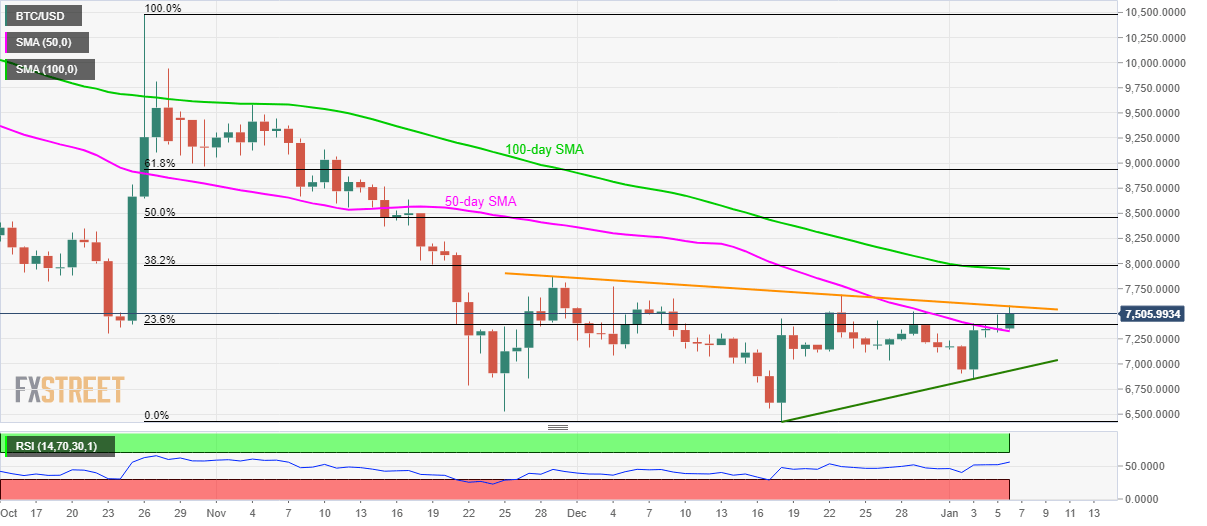
BTC/USD takes the bids to $7,518 during early Monday. In doing so, the pair manages to hold its recovery gains above 50-day SMA while testing the two-week top. Though, a downward sloping trend line since November 29 seems to limit the immediate upside of the Crypto leader.
Hence, buyers will look for a clear run-up beyond $7,575 to justify the strength in confronting $7,945/80 area including 100-day SMA and 38.2% Fibonacci retracement of October-December 2019 declines.
Only if the bulls manage to stay strong above $7,980, prices can extend the recovery towards $8,500 region comprising 50% Fibonacci retracement.
Meanwhile, a daily closing below 50-day SMA level of $7,326 will set the tone for a fresh pullback towards an ascending support line since December 18, at $6,930.
It’s worth mentioning that further selling below $6,930 might not hesitate to recall sub-$6,500 mark on the chart
BTC/USD daily chart
Trend: Pullback expected
Author

Anil Panchal
FXStreet
Anil Panchal has nearly 15 years of experience in tracking financial markets. With a keen interest in macroeconomics, Anil aptly tracks global news/updates and stays well-informed about the global financial moves and their implications.


