|

BTC/USD technical analysis: Bulls stopped in their tracks just ahead of 8,350

  • It was all going so well as BTC/USD broke into positive territory for the session earlier.
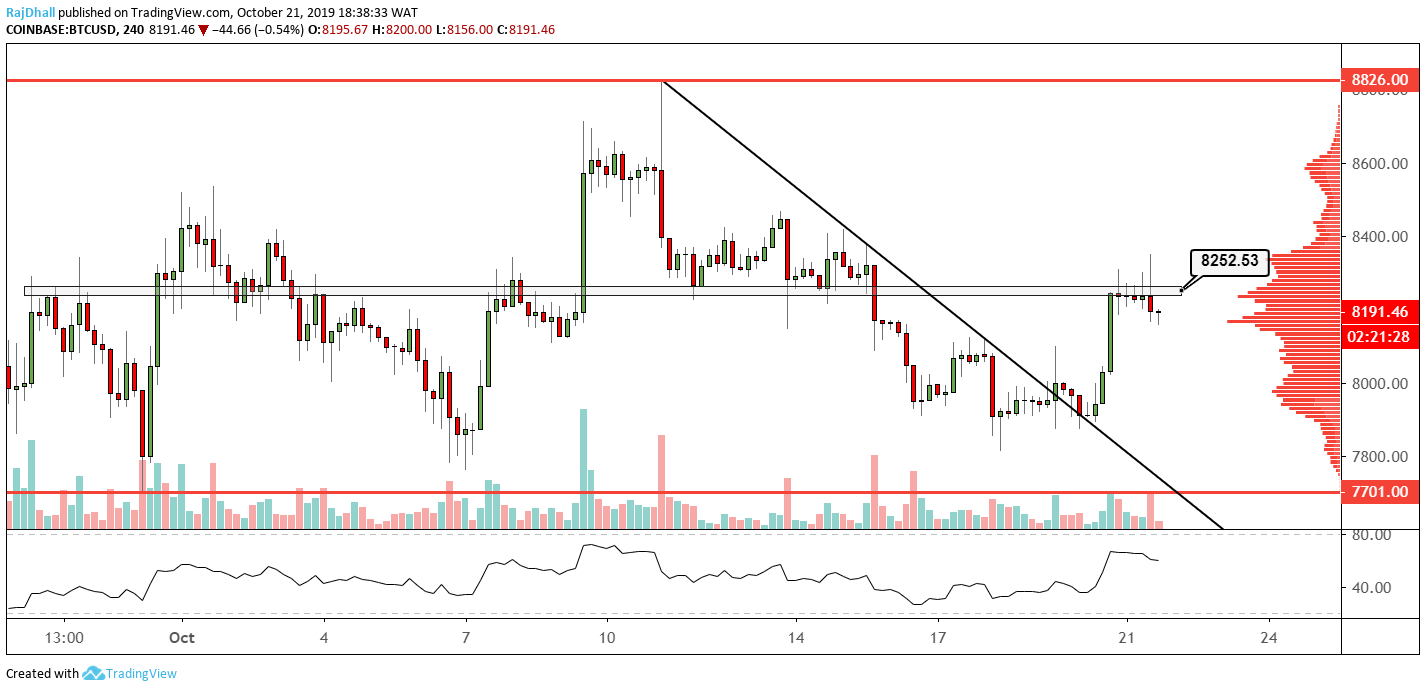
  • There is a key resistance on the four-hour charts that stopped the bulls from reaching higher levels.

The Bitcoin bulls seemed to be in control today as earlier on BTC/USD traded higher after rejecting lower levels on Sunday.

Now the psychological 8K level will come back into focus as the four-hour shooting star candle could indicate some further pain for Bitcoin.

It is interesting how the volume profile indicator (right-hand side) peak keeps acting like a price magnet. Although, in consolidation phases, this is often the case.

If BTC/USD makes a higher low and take out the 8,252 level it would be a bullish sign and that idea could still play out. 

In the short term, we will need to see how much lower the price can go after rejecting 8,252 to the upside.

The trendline break was also a nice bullish move and hopefully hold as price moves lower toward 8k. For now we are looking to see where the price might find support.

Bitcoin Analysis

BTC/USD

Overview
Today last price8189.6
Today Daily Change-46.87
Today Daily Change %-0.57
Today daily open8236.47
 
Trends
Daily SMA208213.31
Daily SMA509159.27
Daily SMA1009795.2
Daily SMA2008811.1
 
Levels
Previous Daily High8307.94
Previous Daily Low7877.13
Previous Weekly High8469.7
Previous Weekly Low7820.15
Previous Monthly High10942.68
Previous Monthly Low7706.37
Daily Fibonacci 38.2%8143.37
Daily Fibonacci 61.8%8041.7
Daily Pivot Point S17973.09
Daily Pivot Point S27709.7
Daily Pivot Point S37542.27 
Daily Pivot Point R18403.9 
Daily Pivot Point R28571.33
Daily Pivot Point R38834.71

Author

Rajan Dhall, MSTA

Rajan Dhall is an experienced market analyst, who has been trading professionally since 2007 managing various funds producing exceptional returns.

More from Rajan Dhall, MSTA
Share:

Editor's Picks

Crypto Today: Bitcoin at $60,000, Ethereum at $1,500, and XRP at $1 face a make-or-break test

Bitcoin (BTC), Ethereum (ETH), and Ripple (XRP) are trading in the red on Friday after three consecutive days of losses, testing their respective make-or-break support levels.

Bitcoin Weekly Forecast: BTC hits 20-month low, will the pain continue?

Bitcoin recovers slightly, trading at $66,000 on Friday after reaching a new yearly low of $58,115 earlier this week, its lowest level since October 2024. Institutional selling intensified as spot ETFs recorded $1.35 billion in net outflows through Thursday.

XRP clings to $1 as long liquidations deepen bearish trend

Ripple trades near the key psychological support level of $1 at the time of writing on Friday after losing more than 8% so far this week. CoinGlass liquidation data shows that over 97% XRP long positions were wiped out over the past 24 hours.

Pi Network Price Forecast: Minor recovery amid market crash fuels short-term hope

Pi Network price records a mild 3% recovery at press time on Friday, shaping a rebound from a broken descending trendline. The declining trend in trading volume has stabilized around $10 million this week, supporting the possibility of an extended recovery as selling pressure wanes.

Bitcoin: Recovery hopes fade after the Fed spoils the party
Bitcoin (BTC) is set to end the week in the red, trading near the 200-Week Simple Moving Average (SMA) at around $62,300 on Friday. Institutional selling persists, capping BTC’s recovery as spot Exchange Traded Funds (ETFs) point to a sixth consecutive week of outflows.
BTC/USD technical analysis: Bulls stopped in their tracks just ahead of 8,350