BTC/USD technical analysis: Bitcoin lost 5% in one hour, more downside is expected

The price of Bitcoin was at $4181 on Monday, then the cryptocurrency decreased to around $4086 and was hovering around 4100 until today. The Big brother fell from $4109 to $3863 on FXOpen where it is now, which is a 5.64% drop.
On the hourly chart, the price has broken out from the ascending channel in which it was correcting. The current red candle indicates strong selling pressure as the majority of the decrease happened in only one hour.
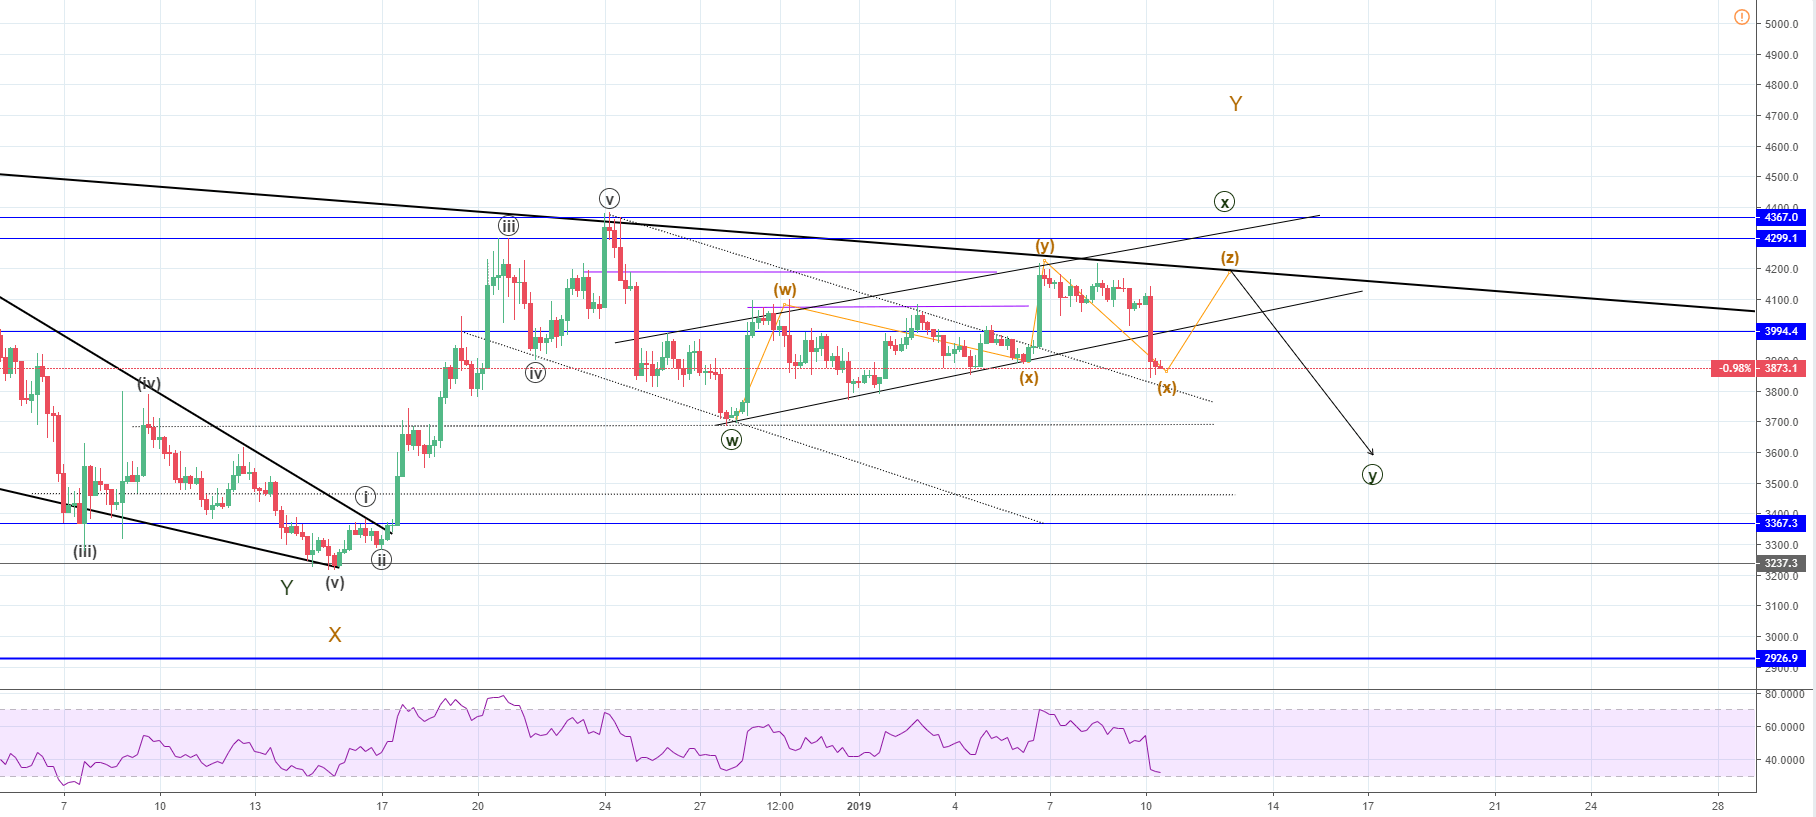
The BTC/USD pair is at the minor horizontal support now. This isn’t a significant support level so a further decrease could happen. If the Minuette WXYXZ correction is in play then recovery from here to the bold black line is expected. The line is the significant downtrend support seen on the higher time frames that now acts as strong resistance. The BTC price came close to it but there wasn’t a proper interaction so if the current Minuette correction ends like projected we could see a proper interaction that would lead the price of Bitcoin to the $4200 area.
However, if the correction ended on the Y wave when the price of Bitcoin was $4177, then what we are currently seeing is the start of the impulsive move to the downside.
In any way, more downside for the price of Bitcoin is expected from here to $3550 area which is the Minute WXY (dark green) W wave length projected from the X wave.
Author

FXOpen Broker Team
FXOpen


