BTC/USD Rebounding from $24k Support

Monday observed a good old-fashioned flight to safety amidst US banking failures in recent days. Safe-haven currencies, such as the Japanese yen and the Swiss franc, benefitted, as did the price of spot gold, climbing 2.0%, and US Treasury bonds ended the London session higher across the curve.
However, what has really caught my attention is Bitcoin and its recent advance, seemingly seeking higher terrain when bank stocks are in free fall. At the time of writing, over the space of three days, we have seen the cryptocurrency rally more than 20.0% after dipping a toe in waters south of the $20,000 mark. Therefore, a comprehensive technical review of BTC/USD is justified.
Technical View: Top-Down Approach
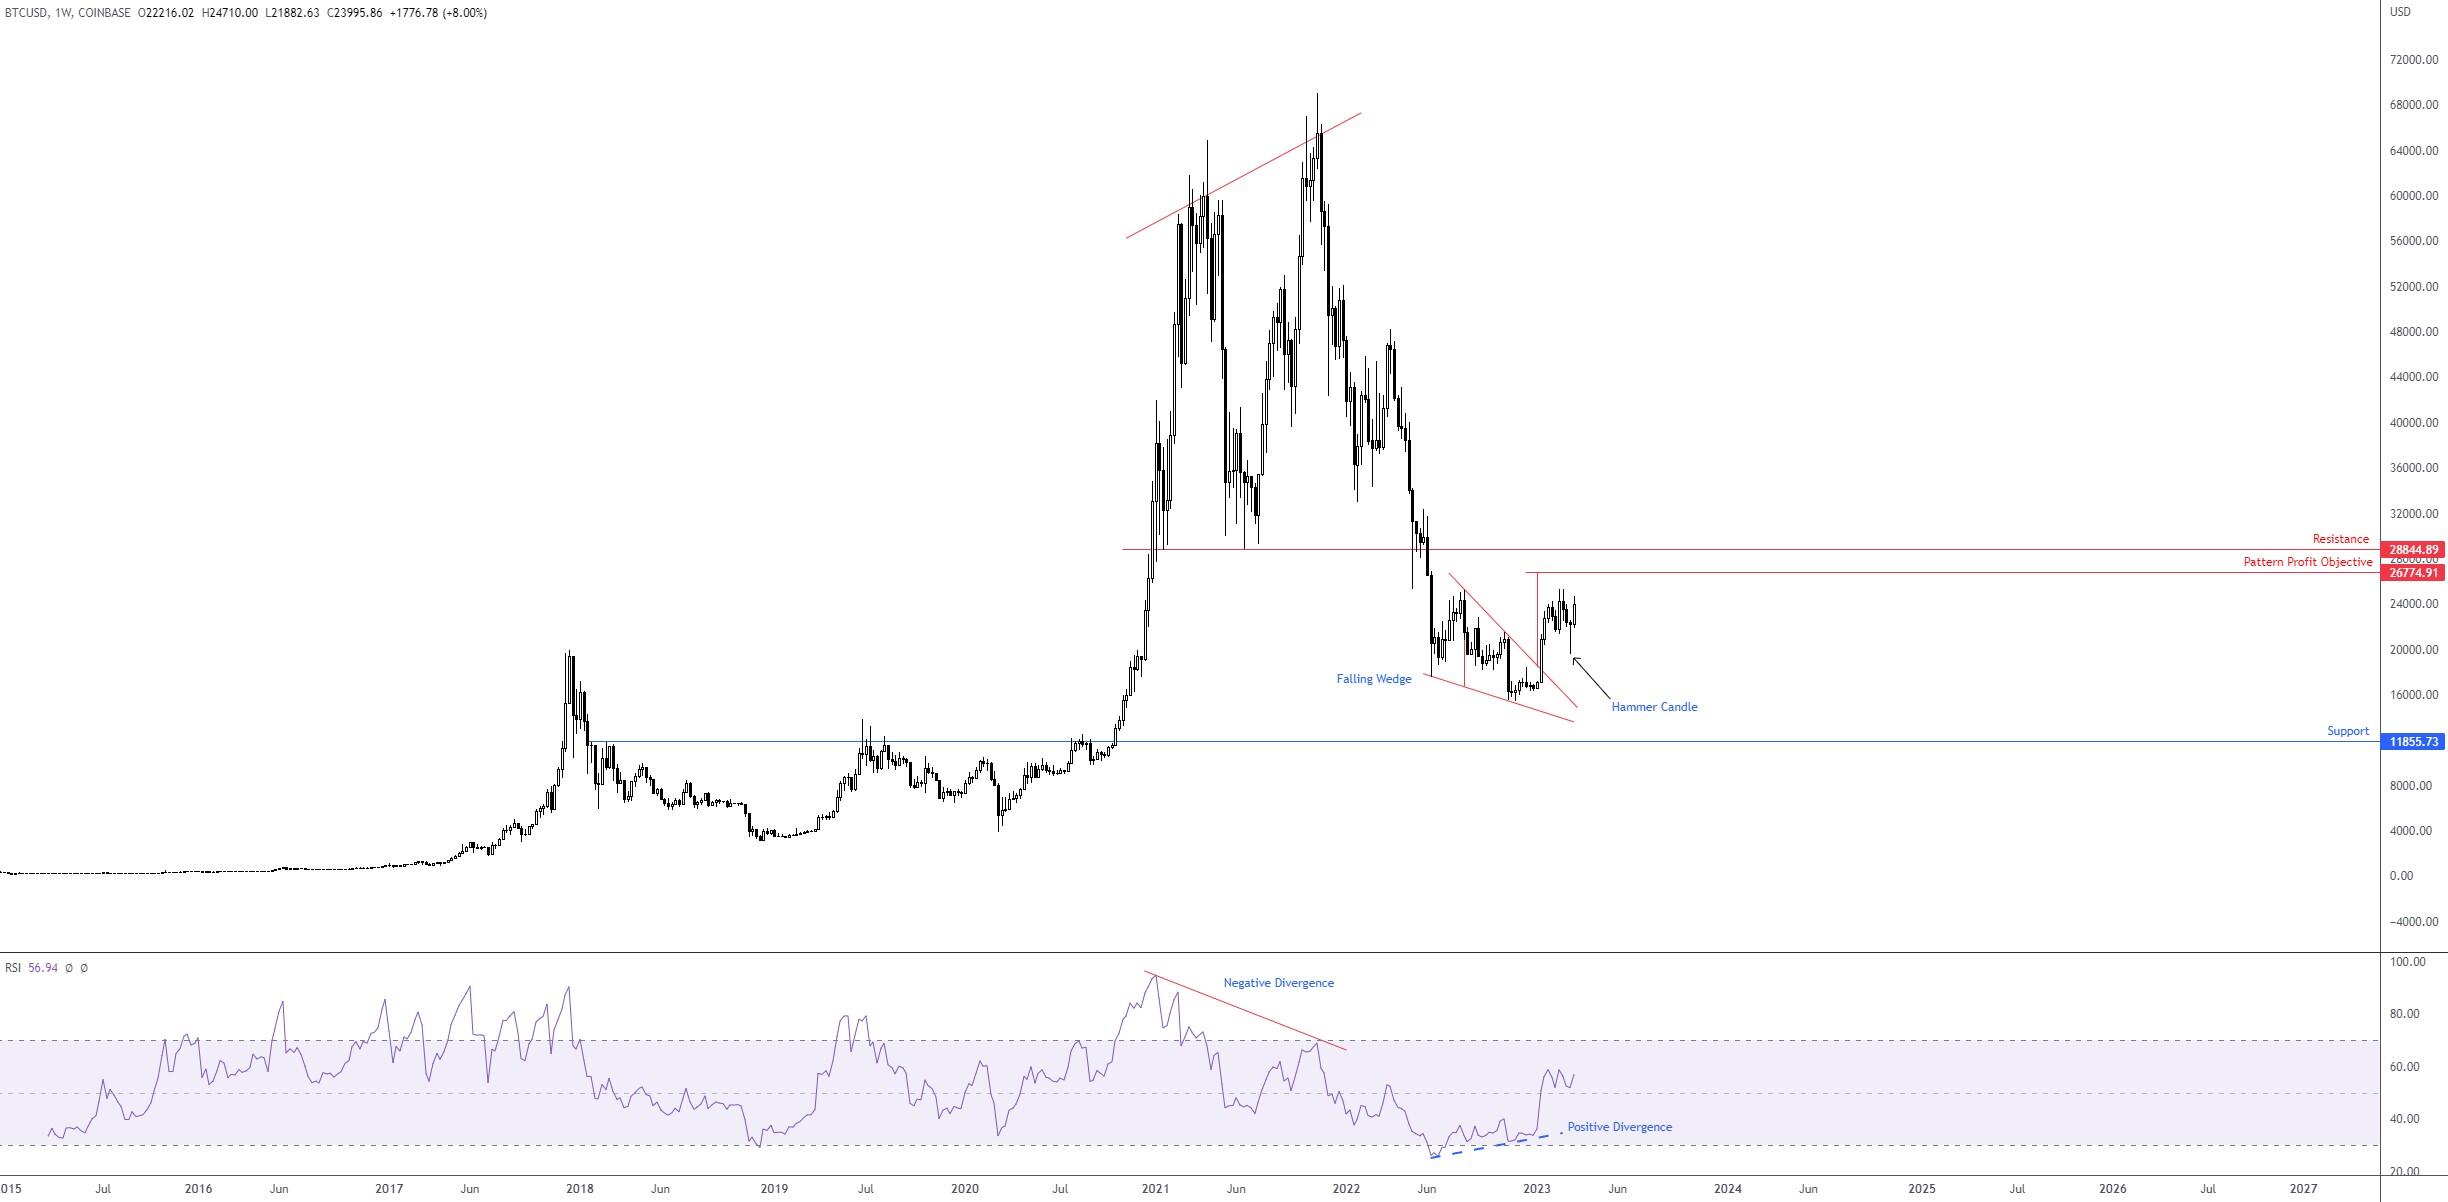
From the weekly timeframe, the major cryptocurrency’s trend direction has been south since topping out just beneath the $70,000 mark in late 2021, a move accompanied by clear-cut negative bearish divergence from the Relative Strength Index (RSI). Fast forward 15 months and last week’s hammer candlestick pattern off the low $19,568, price action on the weekly scale—aided by the RSI attempting to cement position north of its 50.00 centreline—is threatening to take aim at a pattern (falling wedge) profit objective set at $26,774, a level sheltered just south of weekly resistance at 28,844.
As a result of the weekly timeframe, buyers appear to be in the driving seat for the time being.
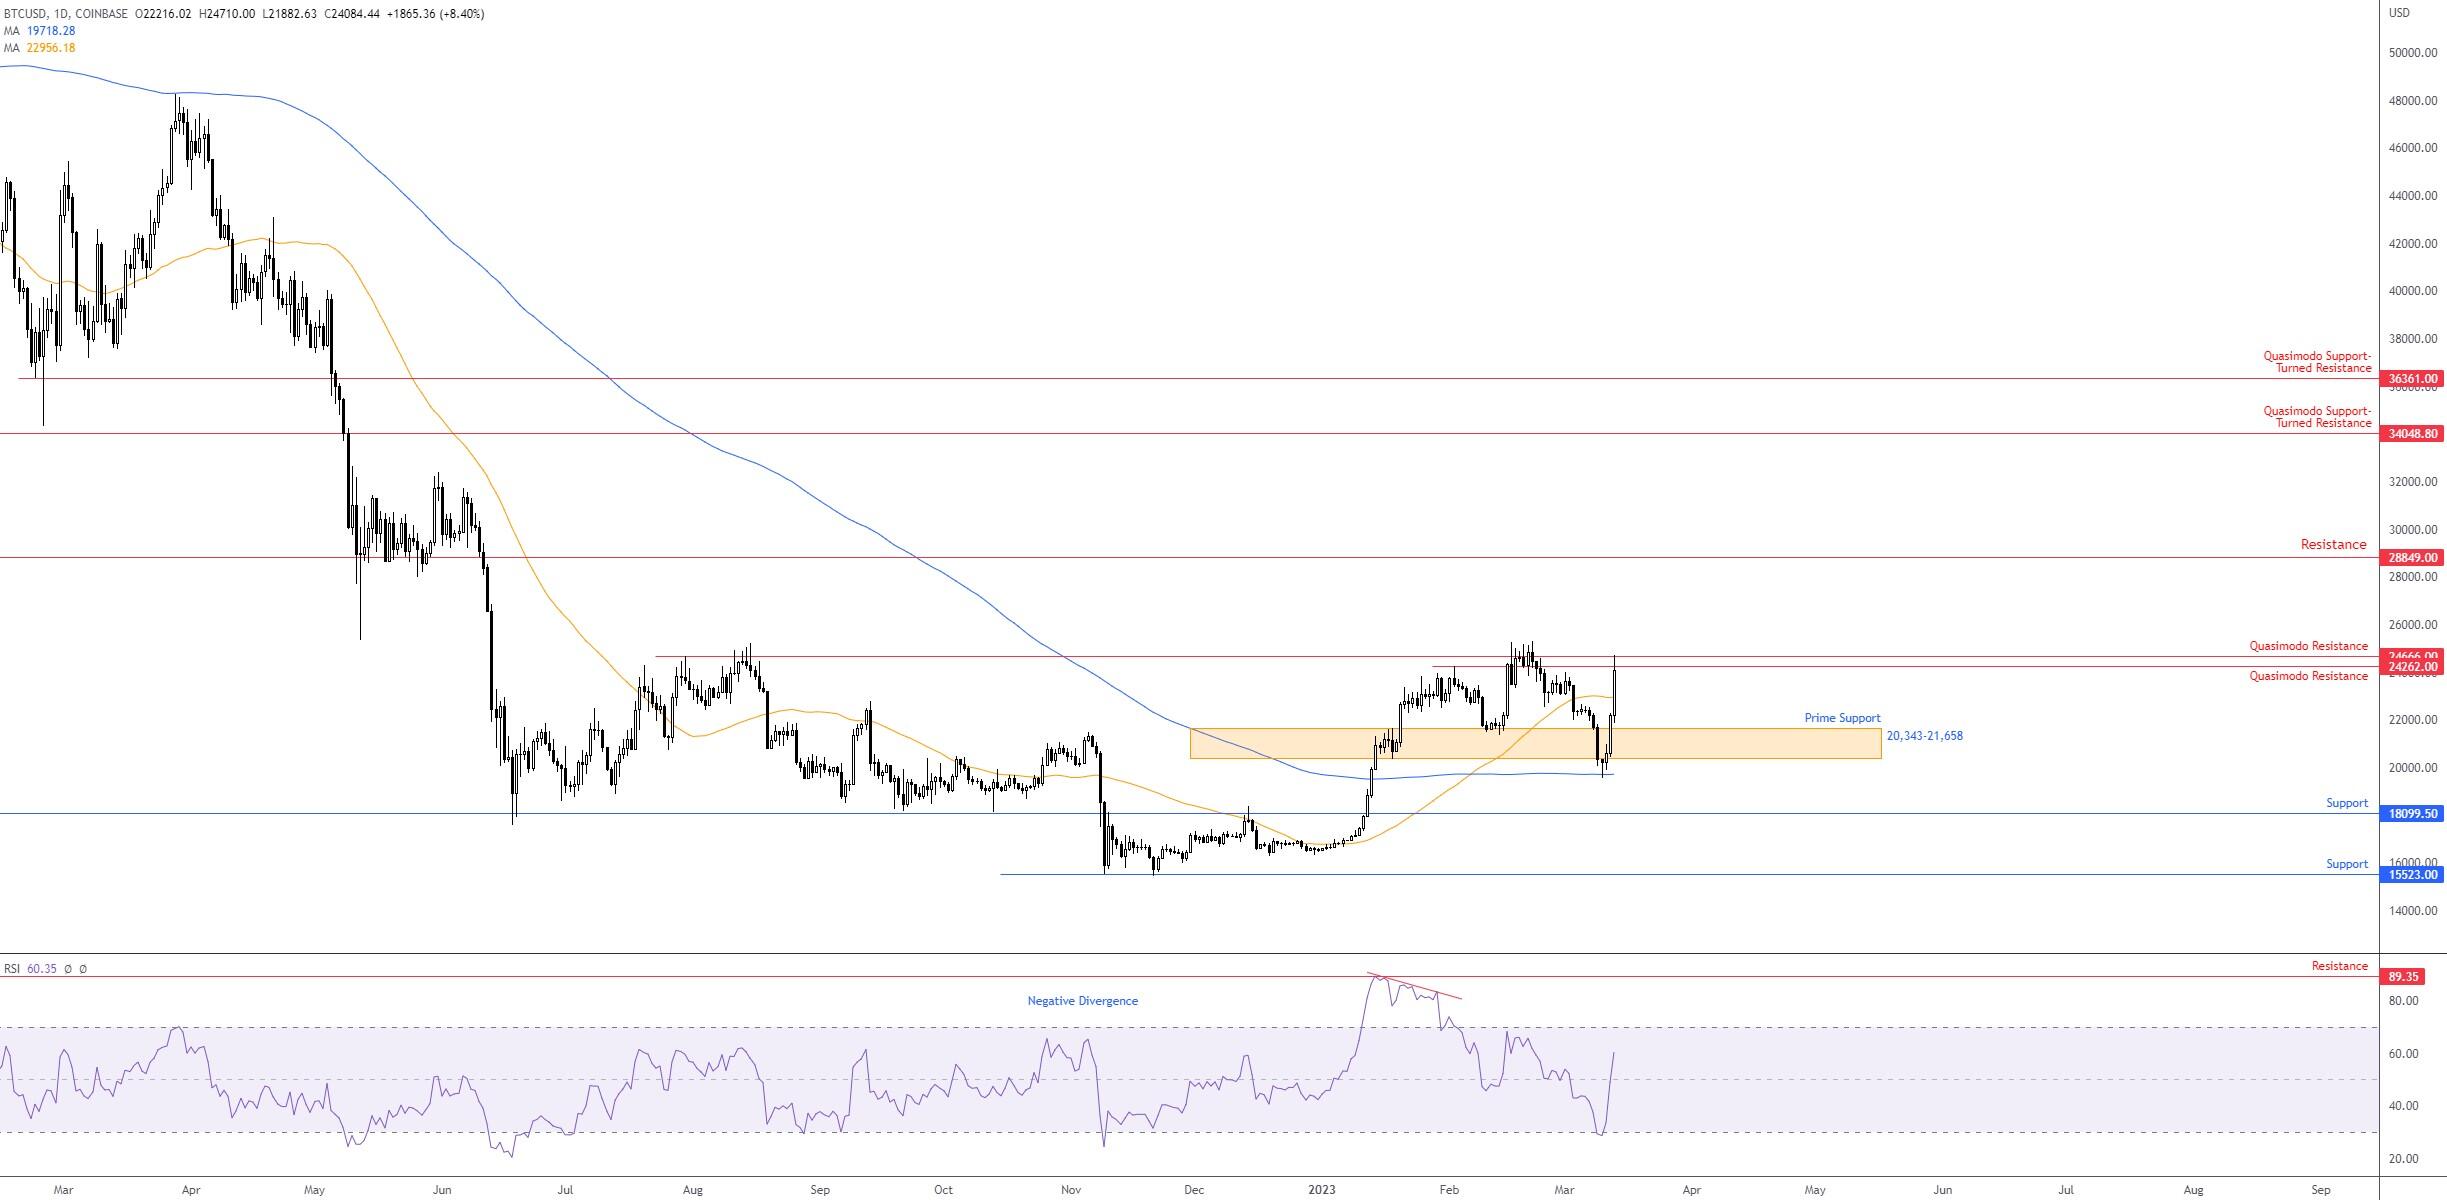
While scope to navigate higher is evident on the weekly timeframe, two Quasimodo resistance levels at $24,666 and $24,262 could throw a technical spanner in the works. However, in the event of another push to the upside, resistance at $28,849 could warrant attention (sat nearby weekly resistance at $28,844). Though recoiling lower from the said resistances has the neighbouring 50-day simple moving average at $22,955 to target, followed by prime support at $20,343-21,658 and the 200-day simple moving average at $19,718.
In terms of where I stand on the RSI, things are positive. We are above the 50.00 centreline (positive momentum in that average gains exceed average losses) and have room to run for overbought space at 70.00.
Short-Term H1 Price Action:
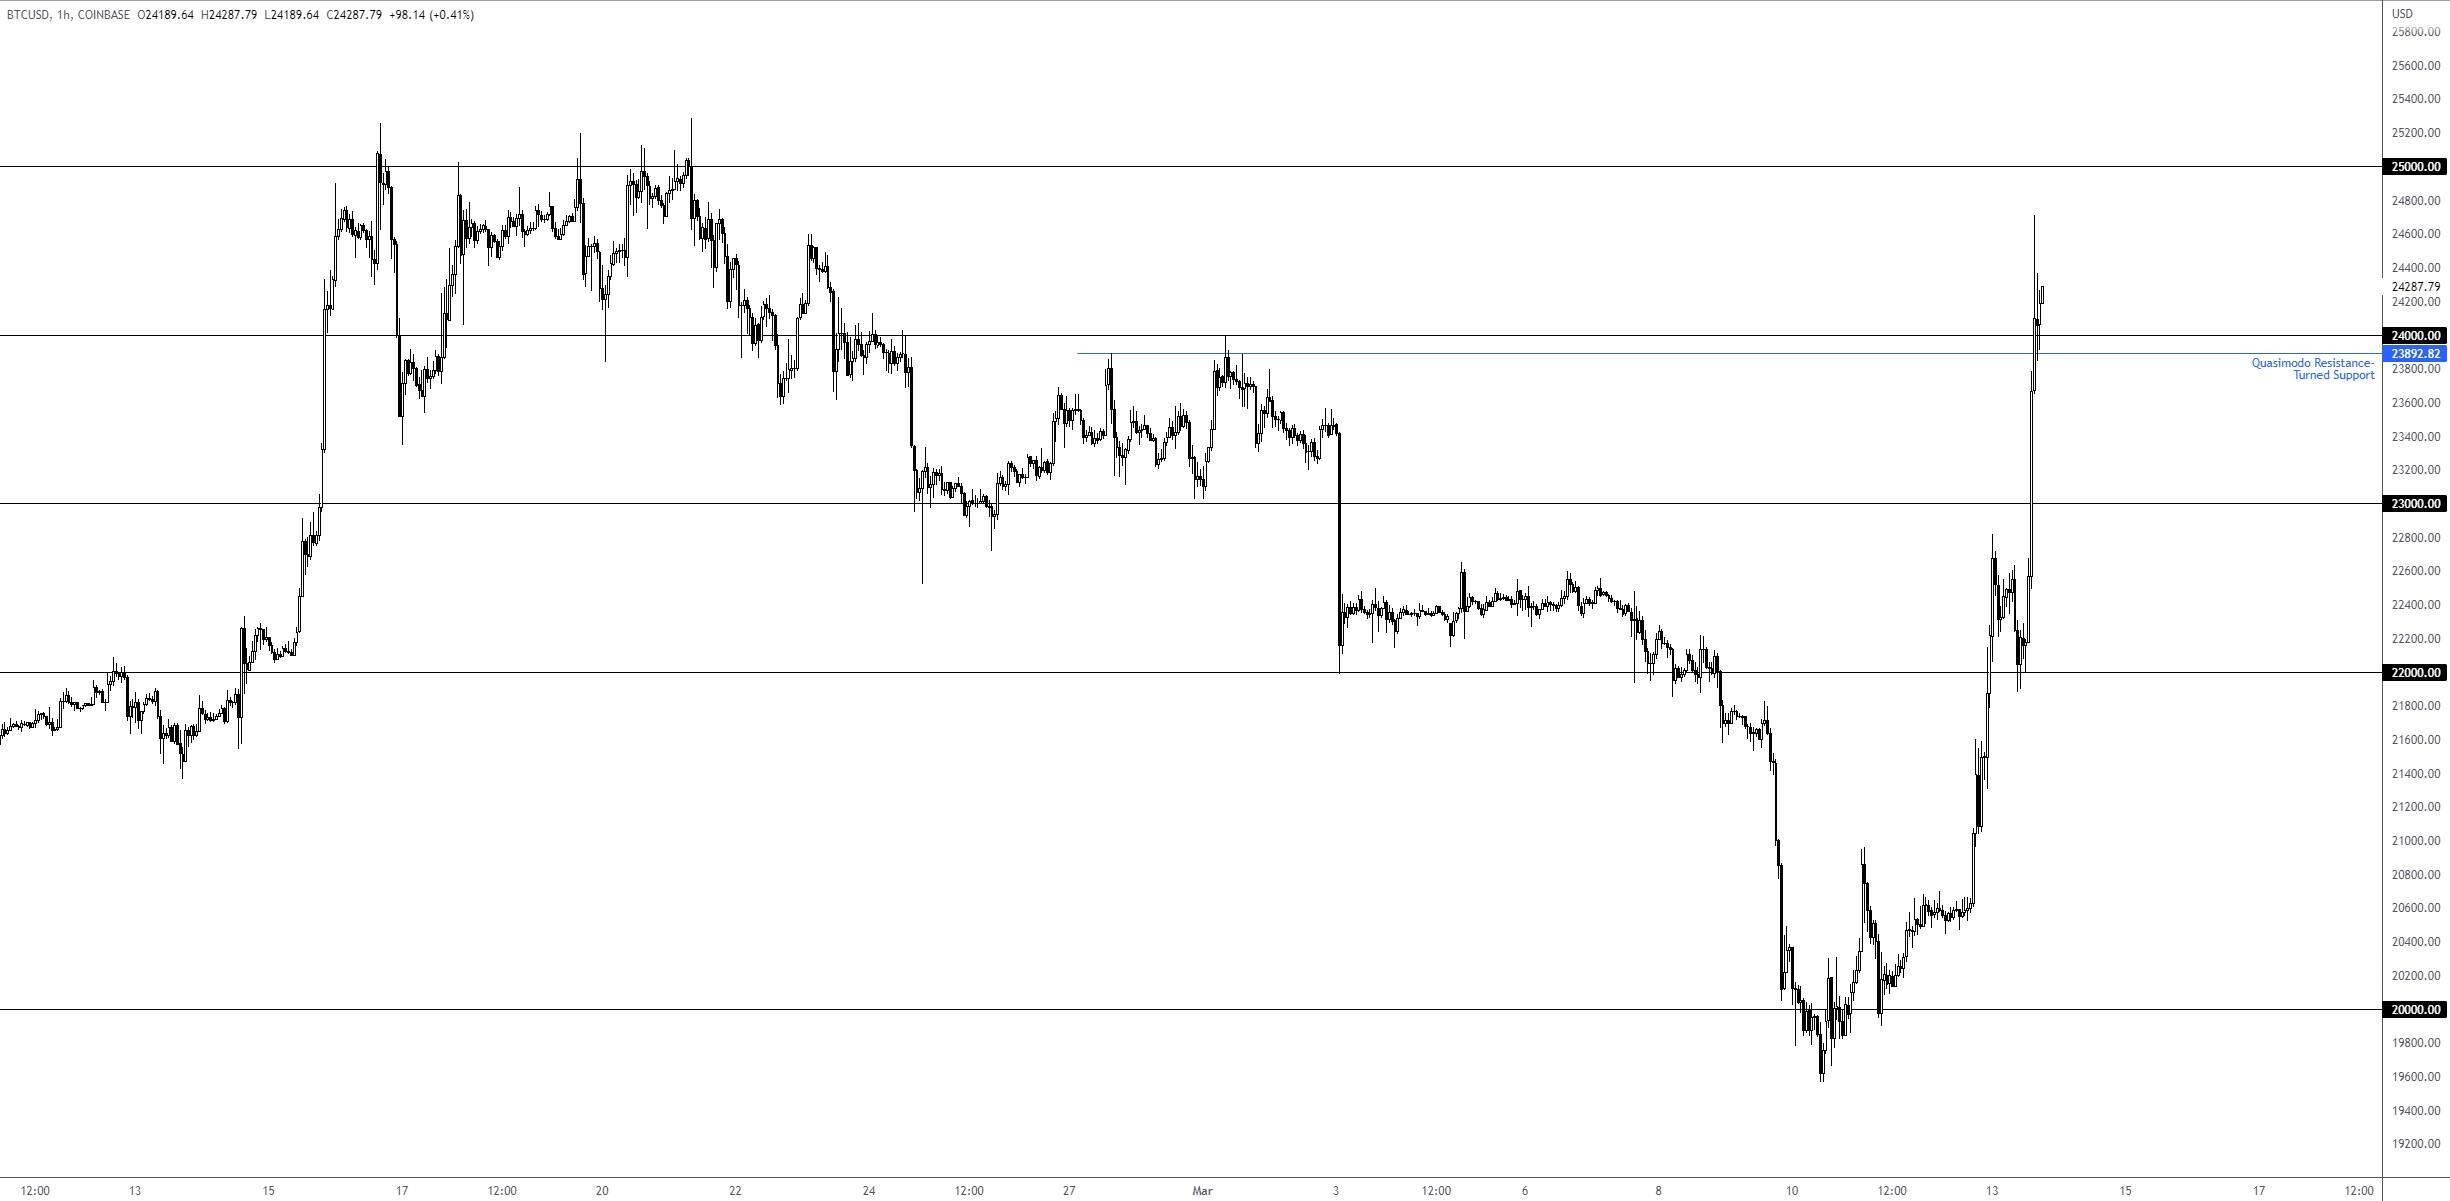
Against the backdrop of the higher timeframes, price action on the H1 timeframe is now retesting the upper side of $24,000 after touching a high of $24,710. Beneath here I also see a nearby Quasimodo resistance-turned support from $23,892. Further buying could see the unit try and reach $25,000, assuming the $24,000 barrier holds out.
So, given the above analysis on each timeframe, the weekly timeframe is in favour of buyers holding $24,000 as H1 support, though daily Quasimodo resistances between $24,666 and $24.262 could prove to be a technical headwind for $24,000 longs.
Although buyers could still struggle, the consensus typically supports the higher timeframes, therefore leaning more on the side of $24,000 holding as support as weekly price exhibits room to move higher.
Author

Aaron Hill
FP Markets
After completing his Bachelor’s degree in English and Creative Writing in the UK, and subsequently spending a handful of years teaching English as a foreign language teacher around Asia, Aaron was introduced to financial trading,


