BTC/USD technical analysis
-
Move up as expected.
-
I am holding the long position.
-
Bullish trend slow but steady.
-
M H3 then M H5 on strong breakout
MEGATREND MAs: Bullish.
D1 Chart BTC/USD
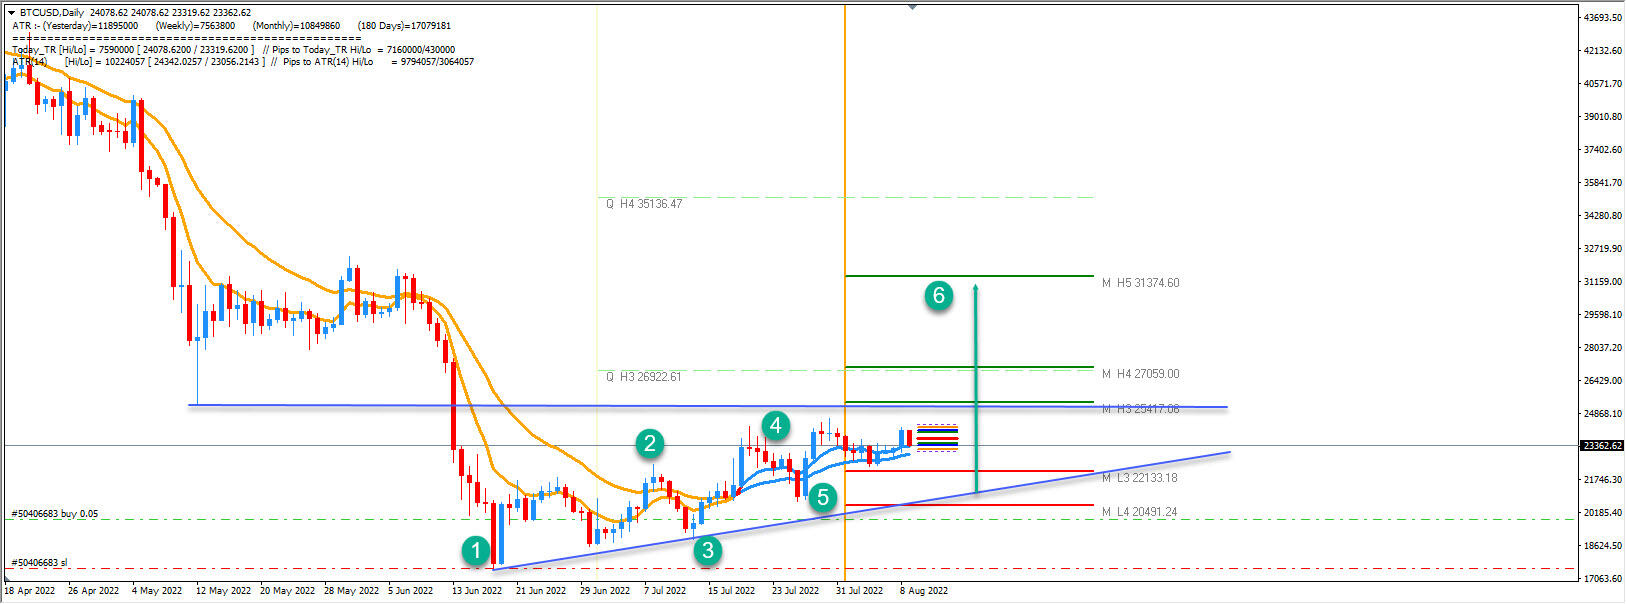
1. Trend line start.
2. Swing high.
3. Higher low.
4. Higher high.
5. Higher low.
6. Breakout target.
The BTC/USD has become an asset. We can spot the strong correlation to US equities especially US100 and SNP500. The market is moving in slow but steady uptrend. You can see my position in the real account and I am of course holding it. When everyone were selling I was buying the BTC due to obvious reasons. The price is engaged in an ascending flat top triangle and the first target is around 25000.
Why do you need inflation? For equities to climb higher. Basically, when there is inflation it means goods and services are being priced higher. which means more revenue for companies. On the flip-side, it can mean more costs for companies. The positive correlation in the BTC/USD and Equity markets is evident and the market should move to the first target. If 25000 breaks we are on the way towards 31000 zone again.
The analysis and the article presents Nenad's opinion. Remember, financial trading is highly speculative & may lead to the loss of your funds. Proper risk management is the Holy Grail of trading.
Recommended Content
Editors’ Picks
Ripple's move above this key level could trigger nearly 50% rally for XRP
Ripple has overcome a critical resistance level and flipped into a support floor on the weekly time frame. This development happened while XRP tightly consolidated for roughly 250 days. Investors can expect XRP to kickstart a massive rally.
Optimism price outlook with nearly $90 million worth of OP tokens flooding markets on Friday
Optimism volatility has shrunk in the ours leading to the network’s cliff unlock. It joins the likes of dYdX and Sui, which have similar events on their calendars. As token unlocks are often considered bearish catalysts, investors should brace for a reaction after the event.
Top 3 Price Prediction Bitcoin, Ethereum, Ripple: Retail watches from the sidelines with a bias for shorts
Bitcoin could clear $73,777 peak as BTC bulls resurface. Ethereum might fall 10% before next leg up as ETH RSI teases with sell signal. XRP could lose $0.6000 threshold as Ripple bulls fail to show up.
Jito price could hit $6 as JTO coils up inside this bullish pattern
Jito price action shows a potential cup and handle formation. Based on theoretical measurement rules, a successful breakout could yield a 56% rally to $6.0. A breakdown of the $3.86 support level would create a lower low for JTO and invalidate the bullish thesis.
Bitcoin: BTC may have recovered, but is it out of the woods?
Bitcoin’s (BTC) upward momentum has shown a significant decline for the past two weeks or so. This development led to a bearish signal on the weekly and an uncertain outlook on the monthly.