|

BTC/USD: Forecasting the recent rally after zigzag correction

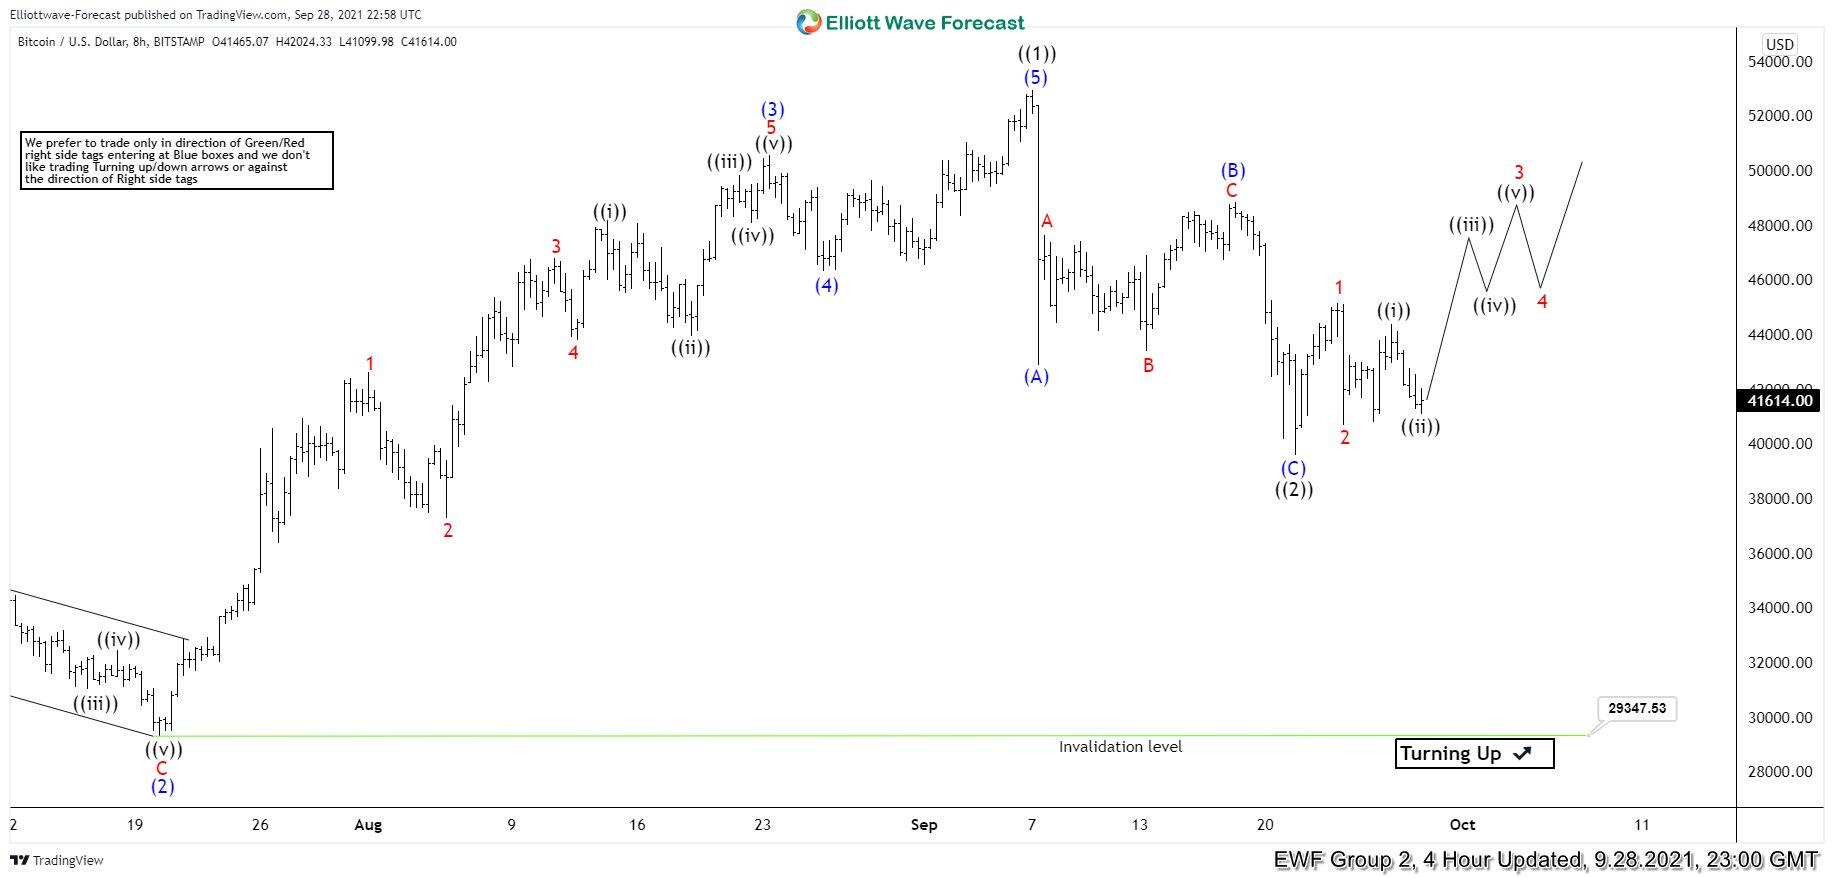
In this article, we will look at the correction in BTCUSD during the month of September and how we called the rally after it completed a Zigzag Elliott wave correction. Chart below is from 28th September 2021 when we called the correction completed and called for the rally to resume. We saw an Elliott wave pattern called nesting which is basically a series of 1-2-((i))-((ii)) and is seen before acceleration in wave ((iii)) takes place.

BTC/USD 4 hour Elliott Wave analysis 9.28.2021

Bitcoin

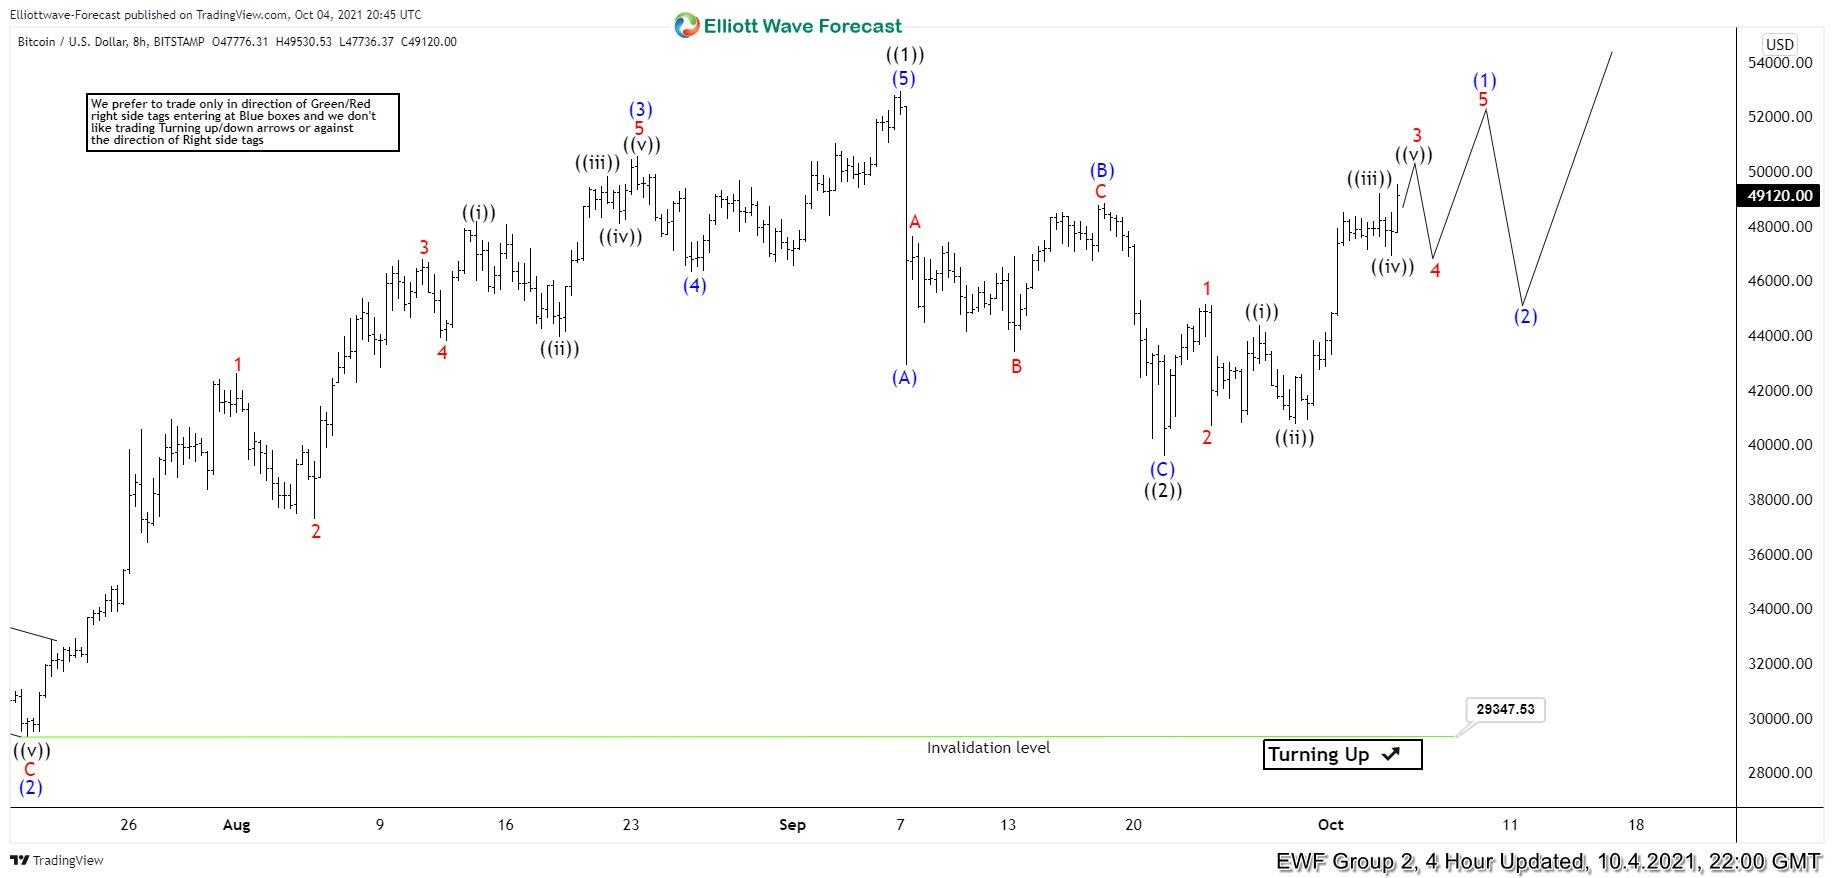
BTC/USD 4 hour Elliott Wave analysis 10.4.2021

BTCUSD held above the low of red 2 and rallied strongly just as the chart on 9.28.2021 anticipated. We can see in the chart below that wave ((iii)) has completed and after a pull back in wave ((iv)), Bitcoin is closer to ending wave ((v)) of 3. Afterwards, we expect a pull back in wave 4 to correct the rally from red 2 low before another high to complete 5 waves up from black ((2)) low. Once wave (1) is completed, expect a pull back in wave (2) to correct the cycle from black ((2)) low before continuation higher. A break of black wave ((1)) peak will add more conviction to this view. Until then, a double correction lower in wave ((2)) can’t be ruled out and if seen, should present another good swing buying opportunity.

Bitcoin

Author

Elliott Wave Forecast Team

Elliott Wave Forecast Team

ElliottWave-Forecast.com

More from Elliott Wave Forecast Team
Share:

Editor's Picks

Ripple exposed to volatility amid low retail interest, modest fund inflows

Ripple (XRP) is extending its intraday decline to around $1.40 at the time of writing on Monday amid growing pressure from the retail market and risk-off sentiment that continues to keep investors on the sidelines.

Crypto Today: Bitcoin steadies around $70,000, Ethereum and XRP remain under pressure 

Bitcoin hovers around $70,000, up near 15% from last week's low of $60,000 despite low retail demand. Ethereum delicately holds $2,000 support as weak technicals weigh amid declining futures Open Interest.

Pi Network extends decline as steady mainnet migration adds pressure

PI edges lower by over 3% at press time on Monday, marking a third consecutive day of losses. The declining trend in PI aligns with the steady mainnet migration of PI tokens, which may fuel selling pressure. The technical outlook for PI remains bearish, with bearish momentum persisting. 

Bitcoin slips below $70,000 as ETF outflows, realized losses fuel bearish outlook

Bitcoin price trades in red below $70,000 on Monday after correcting nearly 9% in the previous week. US-listed spot ETFs recorded a $318 million weekly outflow, marking the third consecutive week of withdrawals.

Bitcoin Price Annual Forecast: BTC holds long-term bullish structure heading into 2026

Bitcoin (BTC) is wrapping up 2025 as one of its most eventful years, defined by unprecedented institutional participation, major regulatory developments, and extreme price volatility.

Bitcoin: The worst may be behind us

Bitcoin (BTC) price recovers slightly, trading at $65,000 at the time of writing on Friday, after reaching a low of $60,000 during the early Asian trading session. The Crypto King remained under pressure so far this week, posting three consecutive weeks of losses exceeding 30%.