BTC/USD: Bitcoin is under pressure at 6553.35

BTC/USD: Bitcoin is under pressure at 6553.35
What is going on with BTC/USD?
BTC/USD: Bitcoin broke through 6444.00 support and reached 6485.20 as highlighted in yesterdays update; however It failed to continue and pulled back to 6407.55.
The pair bounced at 6407.55 in the 60 minutes price chart and broke through 6485.20 on its second attempt. Bitcoin pierced its 500 EMA and reached 6607.20 before retreating to its 500 EMA at 6553.35.
Our forecast
BTC/USD: Bitcoin currently trades at 6559.50 just above its 500 EMA and needs to maintain its position at this level to continue to the upside. Targets to the upside are at 6607.20, 6630.75, and 6665.45. The pair looks weak and could head down to 6520.80 and 6485.20 if it fails to maintain above its 500 EMA. Targets to the downside are at around 6520.80 and 6485.20
Support - 6553.35,6520.80, and 6485.20
Resistance - 6607.20, 6630.75, and 6665.45
Get free access to our trade signals at https://t.me/leoprimefx.
Chart 1: The short-term view of the BTC/USD price action in the 60 minutes price chart highlights the direction of the trend and the support and resistance price points

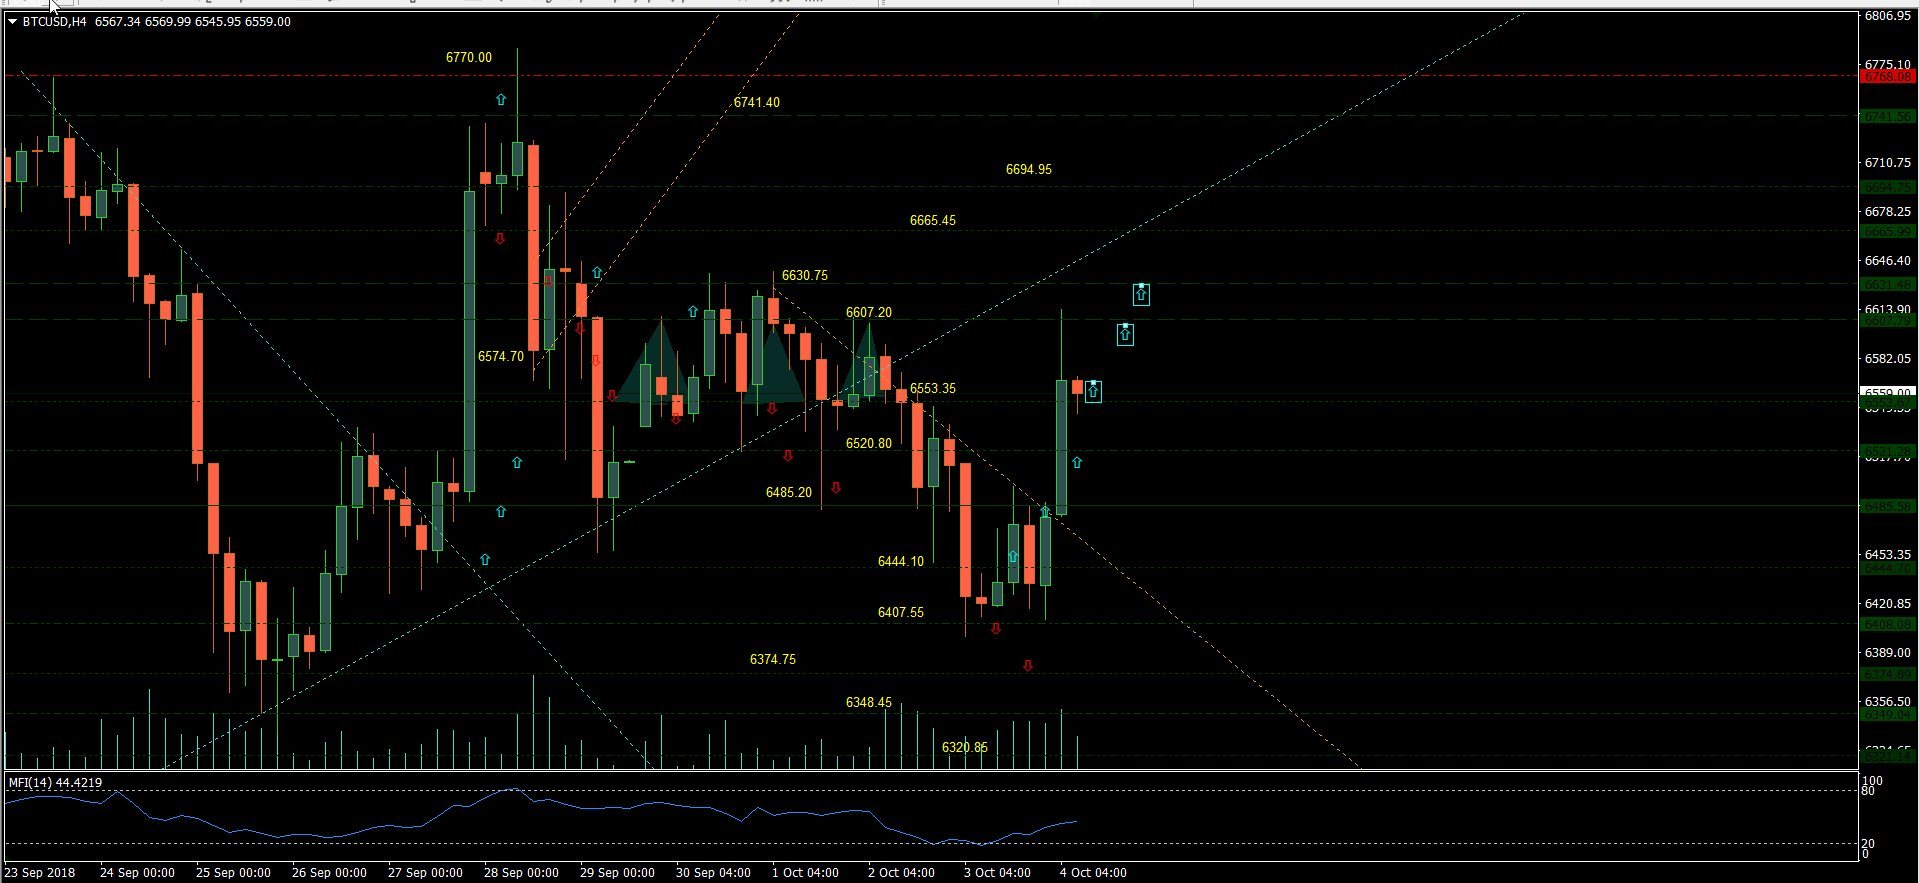
Chart 2: The short-term view of the BTC/USD price action in the four hours price chart highlights the direction of the trend and the support and resistance price points
Author

Denis Joeli Fatiaki
Independent Analyst
Denis Joeli Fatiaki possesses over a decade of extensive experience as a multi-asset trader and Market Strategist.


