|

BTC breaks major bull support: 50-week moving average

Bitcoin (BTC) has broken down from the 50 weekly EMA, this has been a powerful support in 2024 and in 2025 — but this breakdown marks the first time Bitcoin has shown major weakness on a weekly basis.

What are the technical signs you should be watching?

Bitcoin flips bearish with break of weekly 50-EMA

Bitcoin (BTC) weekly chart

Chart

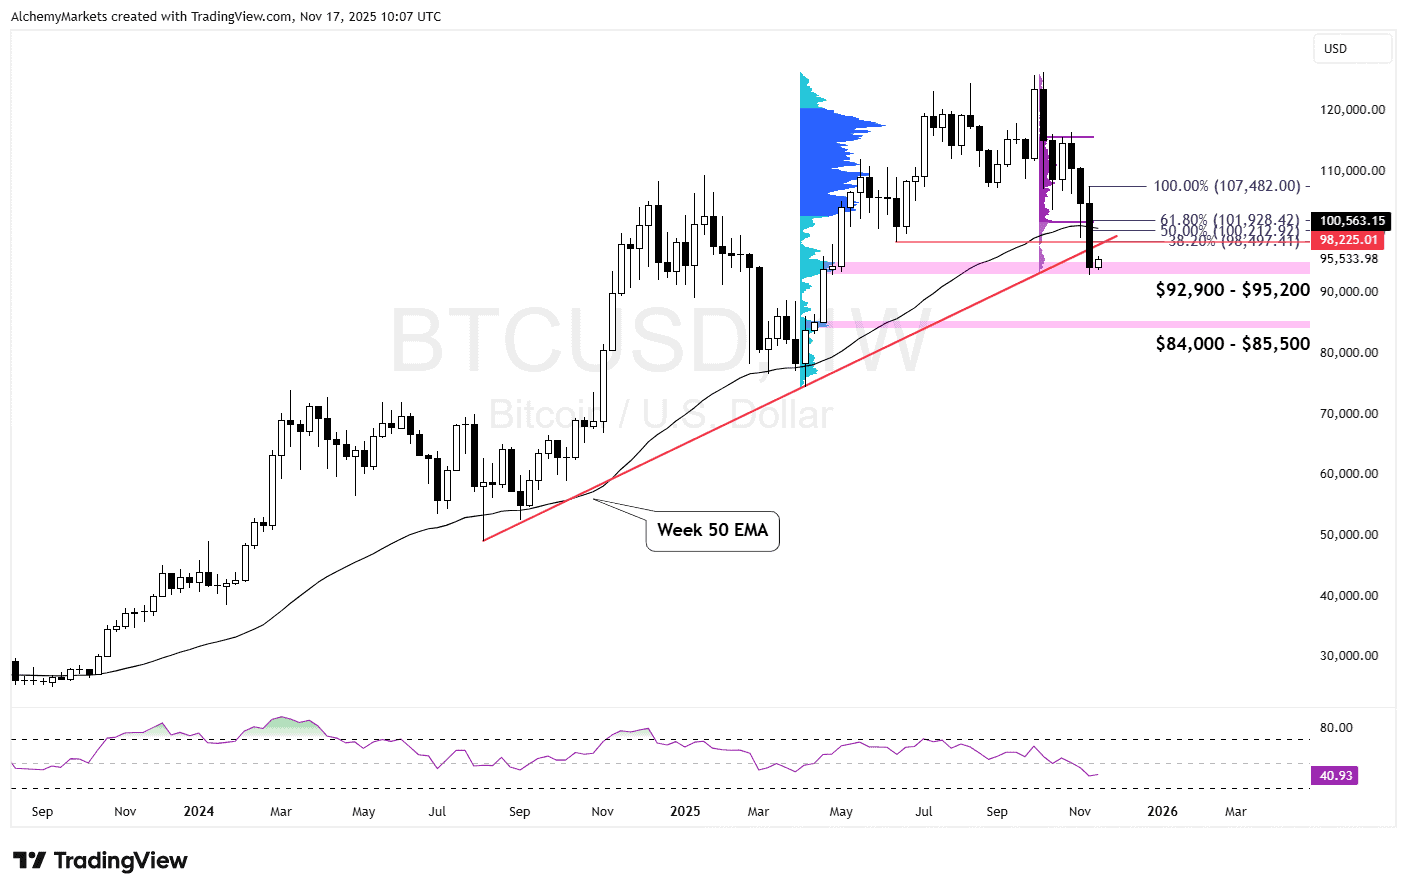
Bitcoin has broken down from two major supports formed in 2024 – 2025:

  • Trendline support from 2024 – 2025 (highlighted in red)
  • Weekly 50-EMA which acted as support from 2024 – 2025

All hope isn’t lost, we are actually at a support at the current zone, a high volume node support ($92,900 – $95,200), marked by a daily order block.

Should we retrace from here, we have a few resistances to watch:

  • 38.2% Fib at $98,497 — Aligns with a previous low, trendline.
  • 50% Fib at $100,212 — Aligns with weekly 50-EMA.
  • 61.8% Fib at $101,928 — Aligns with the Value Area Low of the current decline.

Bitcoin daily chart

Chart

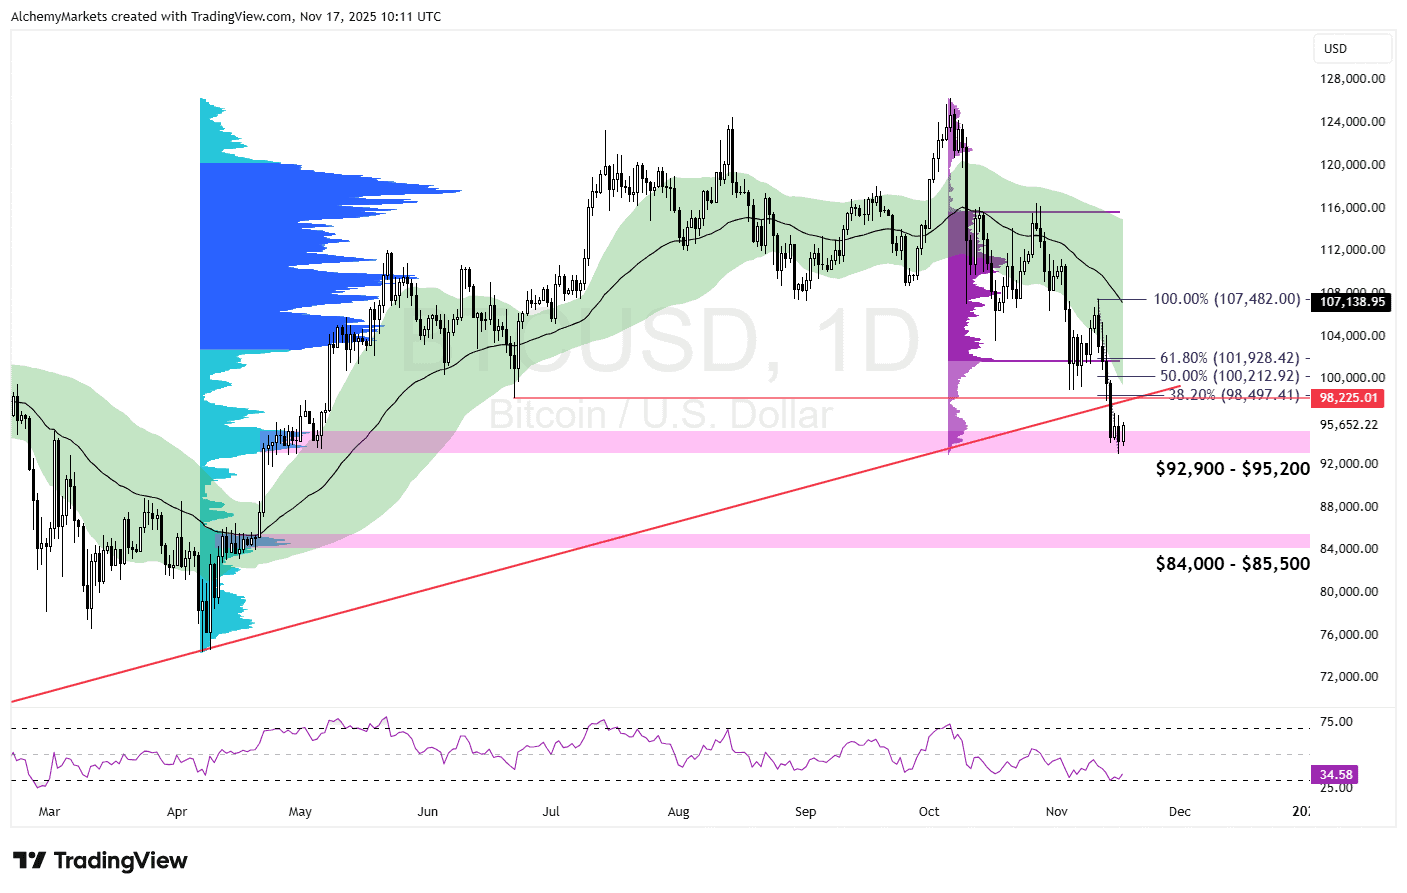
RSI on both the daily and weekly timeframes is deeply depressed but hasn’t actually bottomed below 30 yet. That keeps the door open for a sharp reversal, but it also means there’s still room for price to fall.

If the selloff continues, the next key downside area sits around $84,000–$85,500, where a high-volume node could attract buyers.

In the short term, watch whether the price can hold above $92,900. If we get a retracement, a genuinely bullish trend only comes back into play if price can reclaim and close above the prior high at $107,482 and, ideally, break and hold above the weekly 50 EMA.

Author

Zorrays Junaid

Zorrays Junaid

Alchemy Markets

Zorrays Junaid has extensive combined experience in the financial markets as a portfolio manager and trading coach. More recently, he is an Analyst with Alchemy Markets, and has contributed to DailyFX and Elliott Wave Forecast in the past.

More from Zorrays Junaid
Share:

Editor's Picks

Ripple stabilizes amid mixed signals as ETF inflows resume despite low retail activity

Ripple hovers around the $1.60 pivotal level at the time of writing on Wednesday, reflecting stable but weak sentiment across the crypto market. Intense volatility triggered a brief sell-off on Tuesday, driving the remittance token to pick up liquidity at $1.53 before recovering to the current level.

Crypto Today: Bitcoin, Ethereum, XRP tick up despite macro uncertainty, retail exodus

Bitcoin rises above $76,000 following an extended decline to $72,946 the previous day as Fed-related headlines keep investors on edge. Ethereum advances toward the $2,300 hurdle amid low retail interest, with futures Open Interest falling to $26.3 billion.

Aster Price Forecast: ASTER extends recovery on Stage 6 buyback program

Aster extends recovery on Wednesday, bringing its gains to over 5% so far this week. Aster launches its Stage 6 buyback program, allocating up to 80% of daily fees. Derivatives data show a large capital outflow from ASTER futures Open Interest amid reduced bullish interest.

Bitcoin steadies as bears shift focus toward $70,000

Bitcoin trades above $76,000 on Wednesday, after hitting levels not seen since early November 2024 the previous day. Derivatives traders remain defensive, with the BTC futures premium holding steady around 6.3%, signaling reluctance to take on risk.

Bitcoin Price Annual Forecast: BTC holds long-term bullish structure heading into 2026

Bitcoin (BTC) is wrapping up 2025 as one of its most eventful years, defined by unprecedented institutional participation, major regulatory developments, and extreme price volatility.

Bitcoin: BTC correction deepens as Fed stance, US-Iran risks, mining disruptions weigh

Bitcoin (BTC) price extends correction, trading below $82,000 after sliding more than 5% so far this week. The bearish price action in BTC was fueled by fading institutional demand, as evidenced by spot Exchange-Traded Funds (ETFs), which recorded $978 million in inflows through Thursday.