TRON's TRX price is breaking out, hinting at a 70% upswing

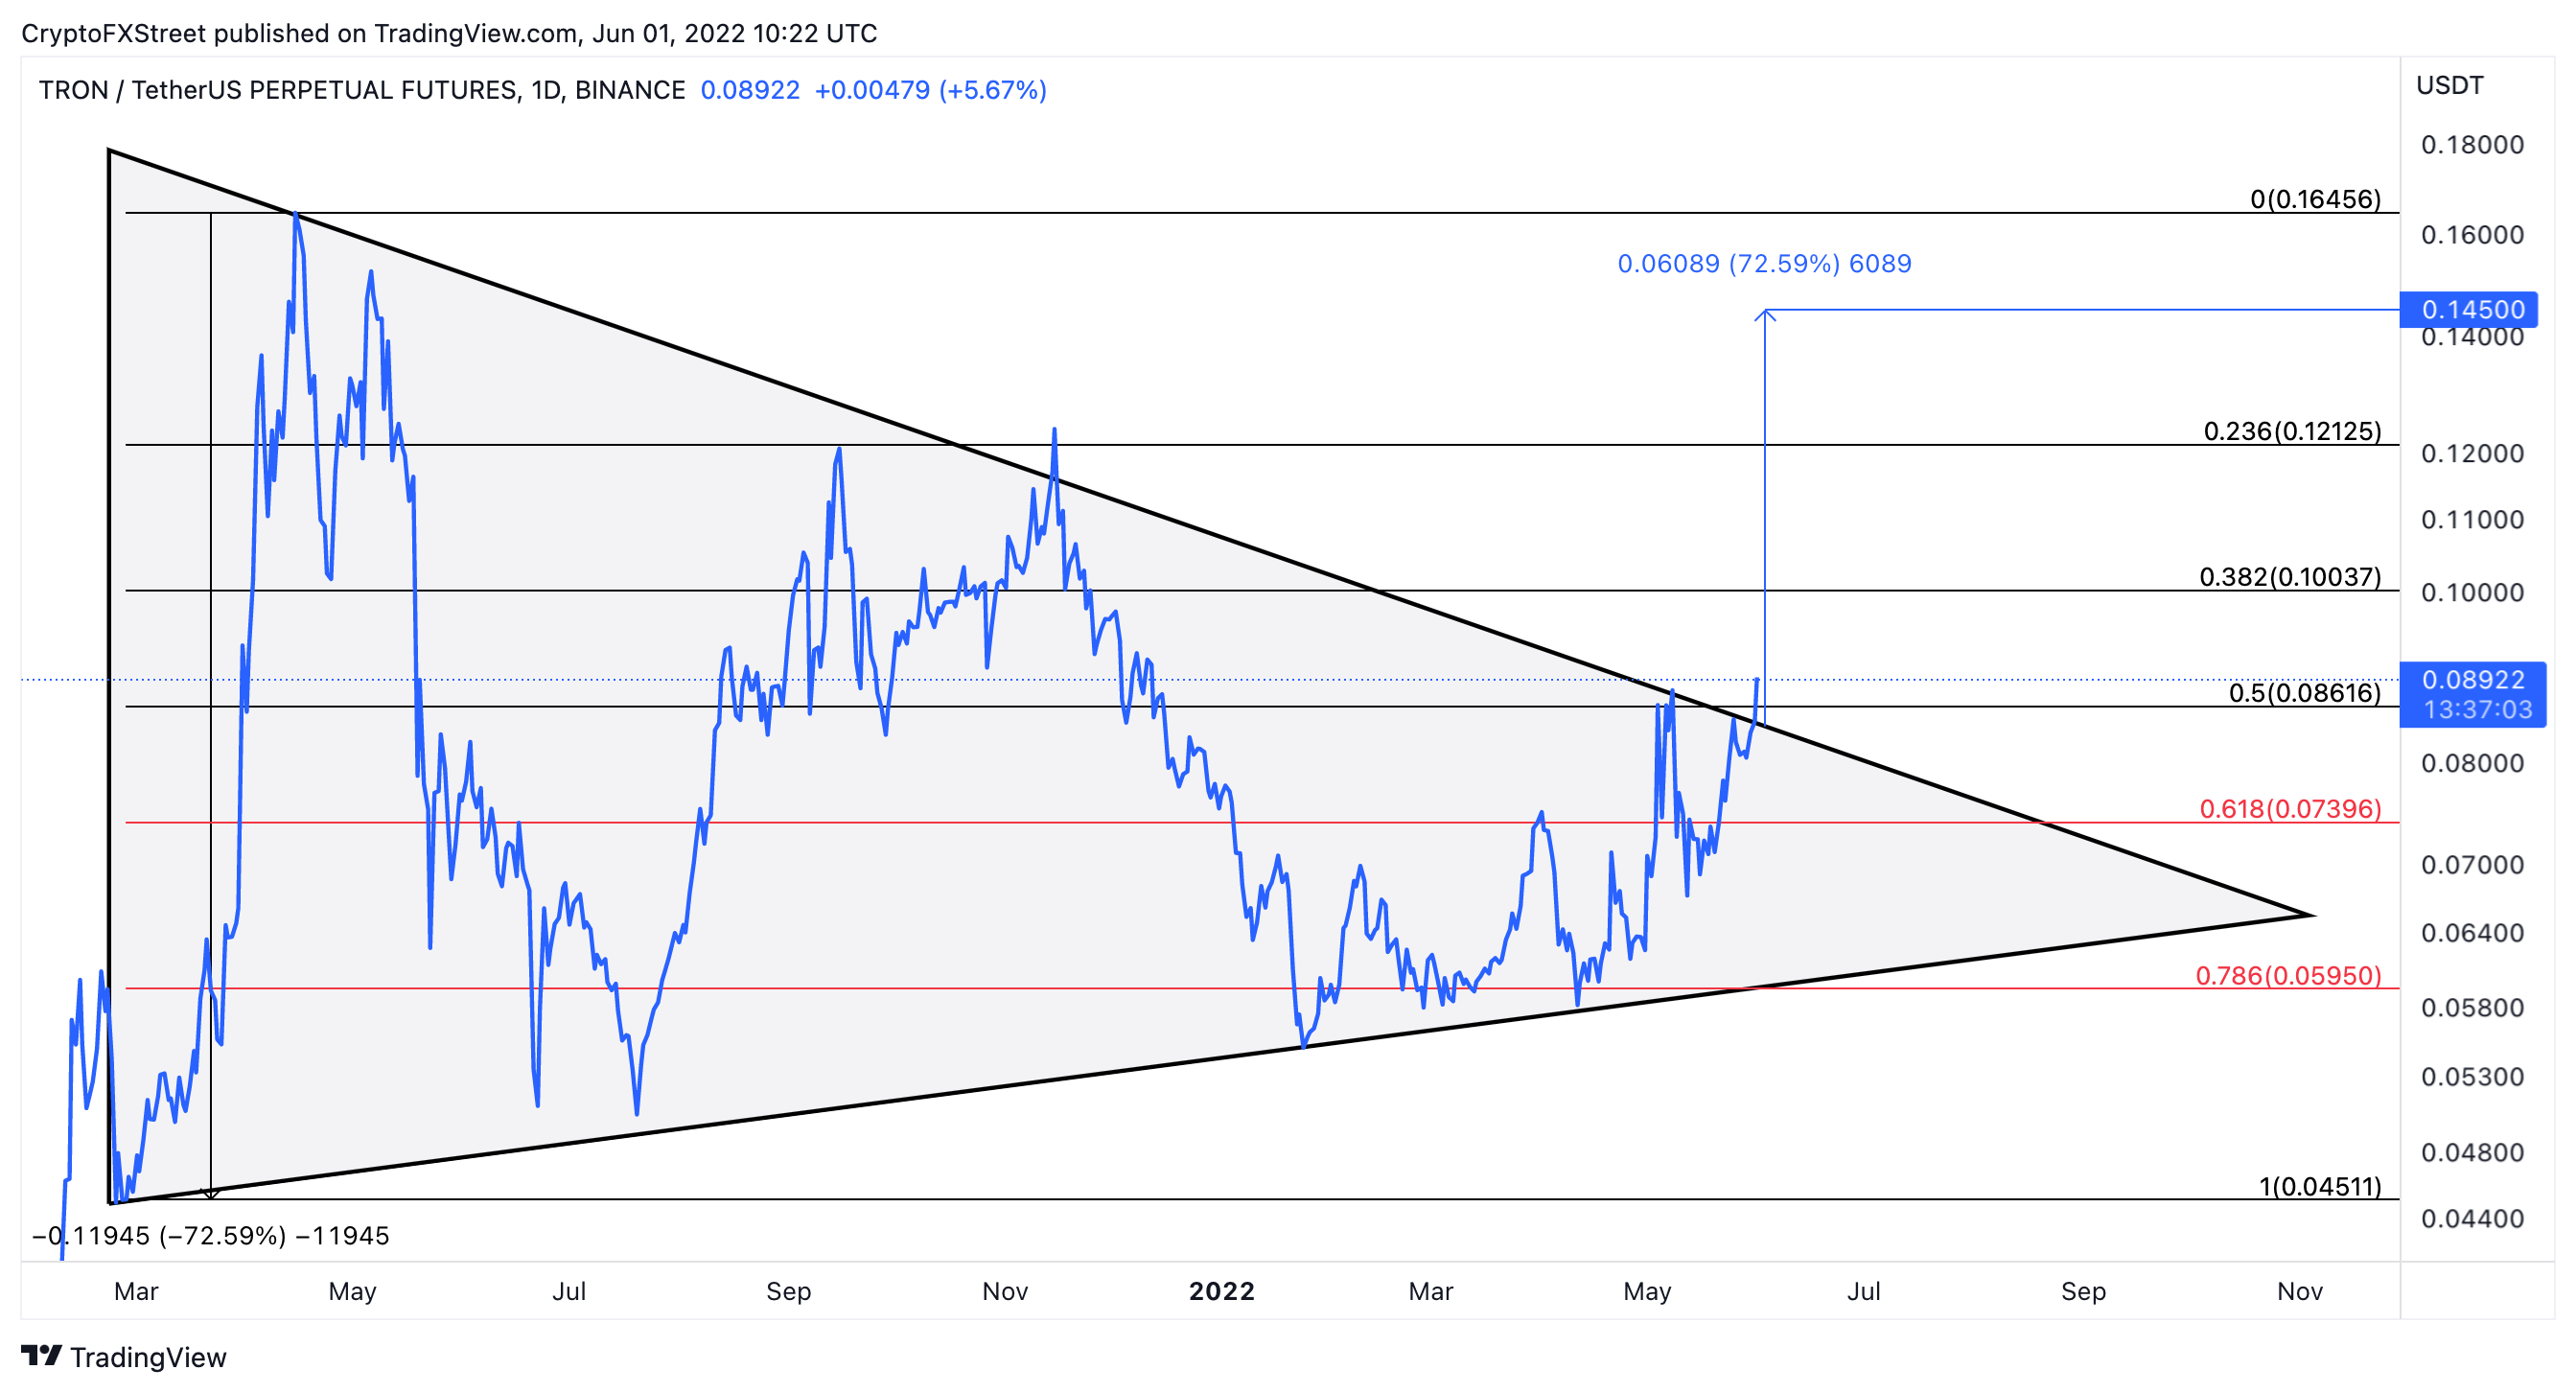
TRON's TRX price appears to be breaking out of a symmetrical triangle that has developed on its daily chart over the past 15 months. TRX price overcame the triangle's upper trendline over the past few hours and has yet to print a daily candlestick close above $0.086 to confirm the bullish outlook.
Slicing through such a significant resistance level at $0.086 could trigger a 72.60% bull rally that sends TRX price to $0.145.
TRX daily chart
It is worth noting that failing to overcome the $0.086 resistance level will likely invalidate the bullish thesis and result in a correction to $0.074. But dipping below this support level can lead to further losses as the next important area of interest is at $0.060.
Is it good to buy Terra’s LUNA 2.0?
Analysts at FXStreet have evaluated the Terra LUNA 2.0 price chart and the token’s potential after its relaunch. In the following video, Akash Girimath, a leading cryptocurrency analyst at FXStreet reveals whether it is profitable to buy Terra’s LUNA 2.0 tokens.
Author
FXStreet Team
FXStreet
Composed of a group of economic journalists and FX experts, the FXStreet content team produces and oversees all content published on FXStreet. It provides a purely journalistic approach to the Forex market.


