BNB Price Forecast: Poised for a decline on negative Funding Rate
- BNB price hovers around $696.40 on Thursday after declining 4.58% in the past two days.
- BNB’s momentum indicators hint at a further decline as RSI and MACD show bearish signals.
- Coinglass’s OI-weighted funding rate data is negative, suggesting potential downward pressure on BNB’s price.
BNB (BNB) price hovers around $696.40 on Thursday after declining 4.58% in the previous two days. BNB’s momentum indicators hint for a further decline as its Relative Strength Index (RSI) and Moving Average Convergence Divergence (MACD) show bearish signals. Additionally, Coinglass’s OI-weighted funding rate data is also negative, suggesting potential downward pressure on BNB’s price.
BNB price action shows signs of weakness
BNB price retested its 50-day EMA support level around $683.98 on Wednesday after declining 4.58% since Tuesday. At the time of writing on Thursday, it hovers at around $696.40, just above its 50-day EMA.
If BNB continues to face a pullback and closes below the $696.40 level, it could extend the decline to test its next daily support level at $612.50.
The Relative Strength Index (RSI) on the daily chart reads 49, below its neutral level of 50 and points downwards, indicating bearish momentum. Moreover, the Moving Average Convergence Divergence (MACD) indicators show a bearish crossover on Wednesday, indicating sell signals and a downtrend.
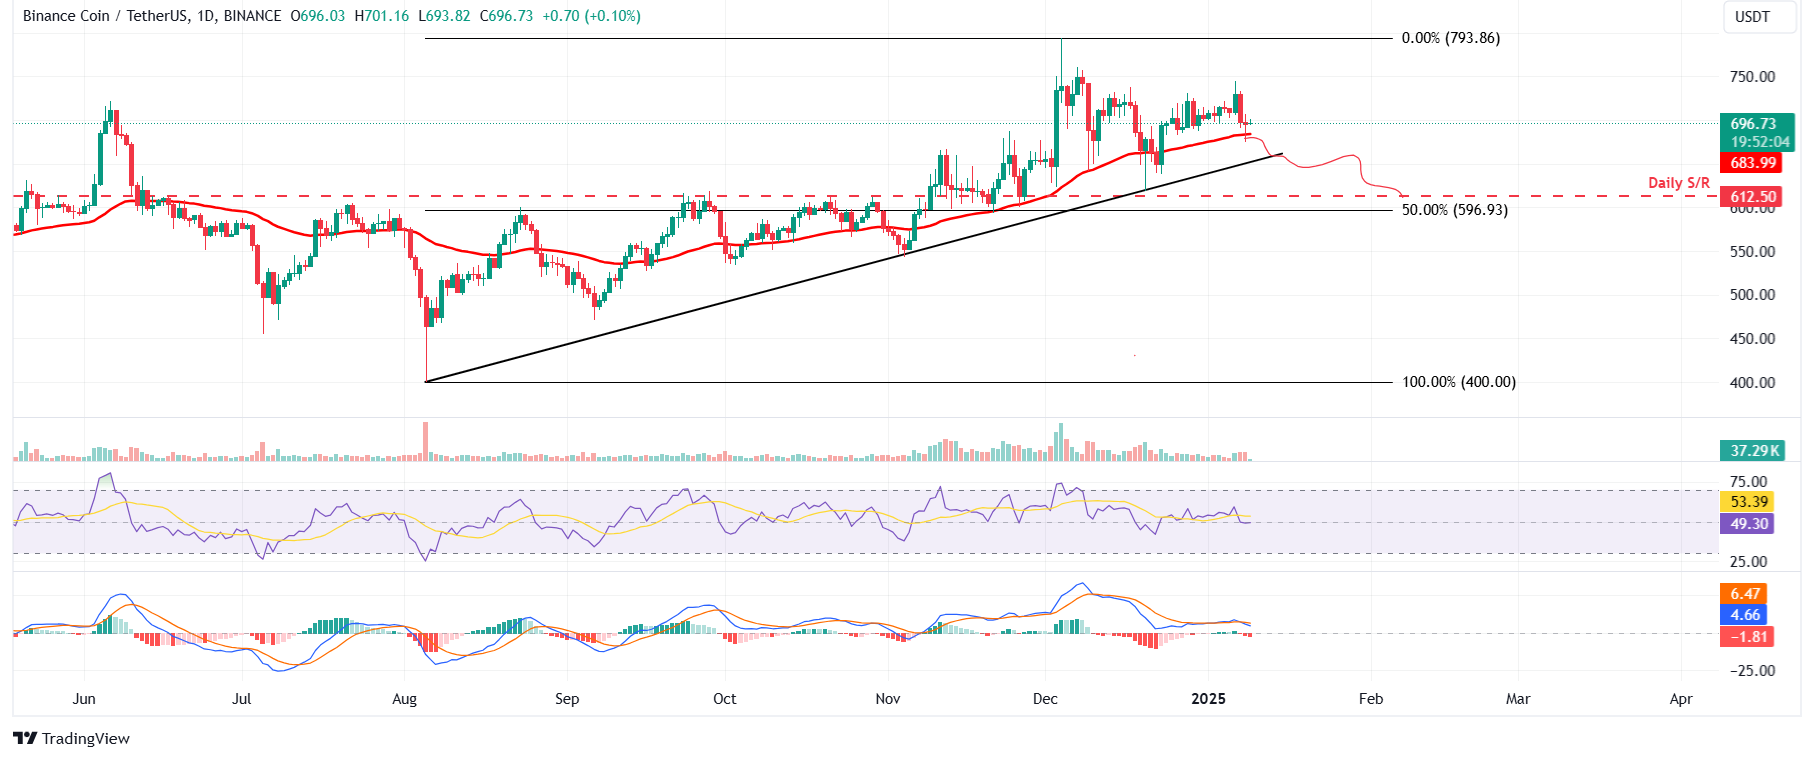
BNB/USDT daily chart
According to Coinglass’s OI-Weighted Funding Rate data, the number of traders betting that the price of BNB will slide further is higher than that anticipating a price increase.
This index is based on the yields of futures contracts, which are weighted by their open interest rates. Generally, a positive rate (longs pay shorts) indicates bullish sentiment, while negative numbers (shorts pay longs) indicate bearishness.
In the case of BNB, this metric stands at -0.0137%, reflecting a negative rate and indicating that shorts are paying longs. This scenario often signifies bearish sentiment in the market, suggesting potential downward pressure on BNB’s price.
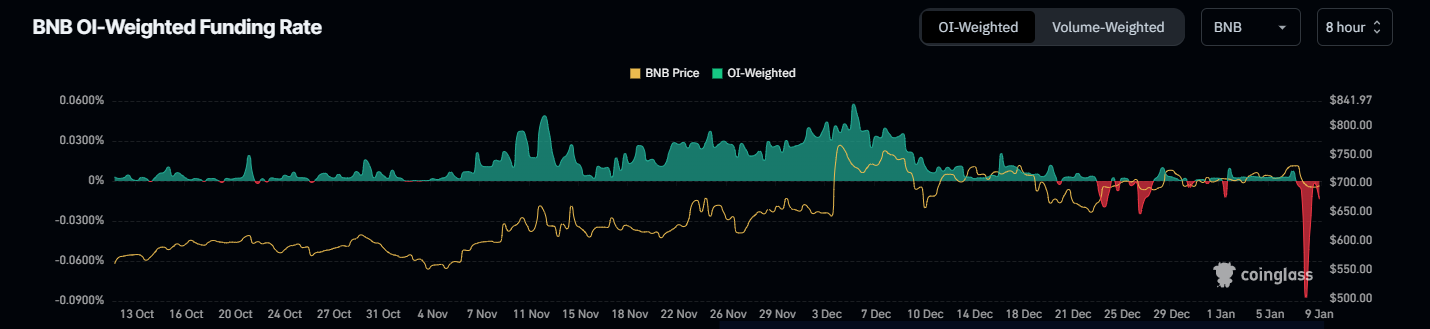
BNB OI-Weighted Funding Rate data chart. Source: Coinglass
Author

Manish Chhetri
FXStreet
Manish Chhetri is a crypto specialist with over four years of experience in the cryptocurrency industry.


