BNB Price Forecast: Key resistance trendline in focus as whale interest spikes
- BNB recovery challenges a long-standing resistance trendline, with bulls aiming for a breakout.
- Derivatives data suggest an increase in futures average order size, indicating a spike in interest among large wallet investors.
- The technical outlook remains mixed, as BNB stands at a crucial crossroads with tepid momentum.

BNB (previously known as Binance Coin) is up 1% at press time on Monday, marking a solid start to the week, with bulls aiming for a potential breakout of a resistance trendline. Derivatives data suggest a growing interest from large wallet investors, commonly referred to as whales, as BNB approaches a crucial crossroads.
Still, the technical outlook for BNB remains uncertain, as momentum indicators stand at a neutral level.
BNB regains retail demand, but there’s a catch!
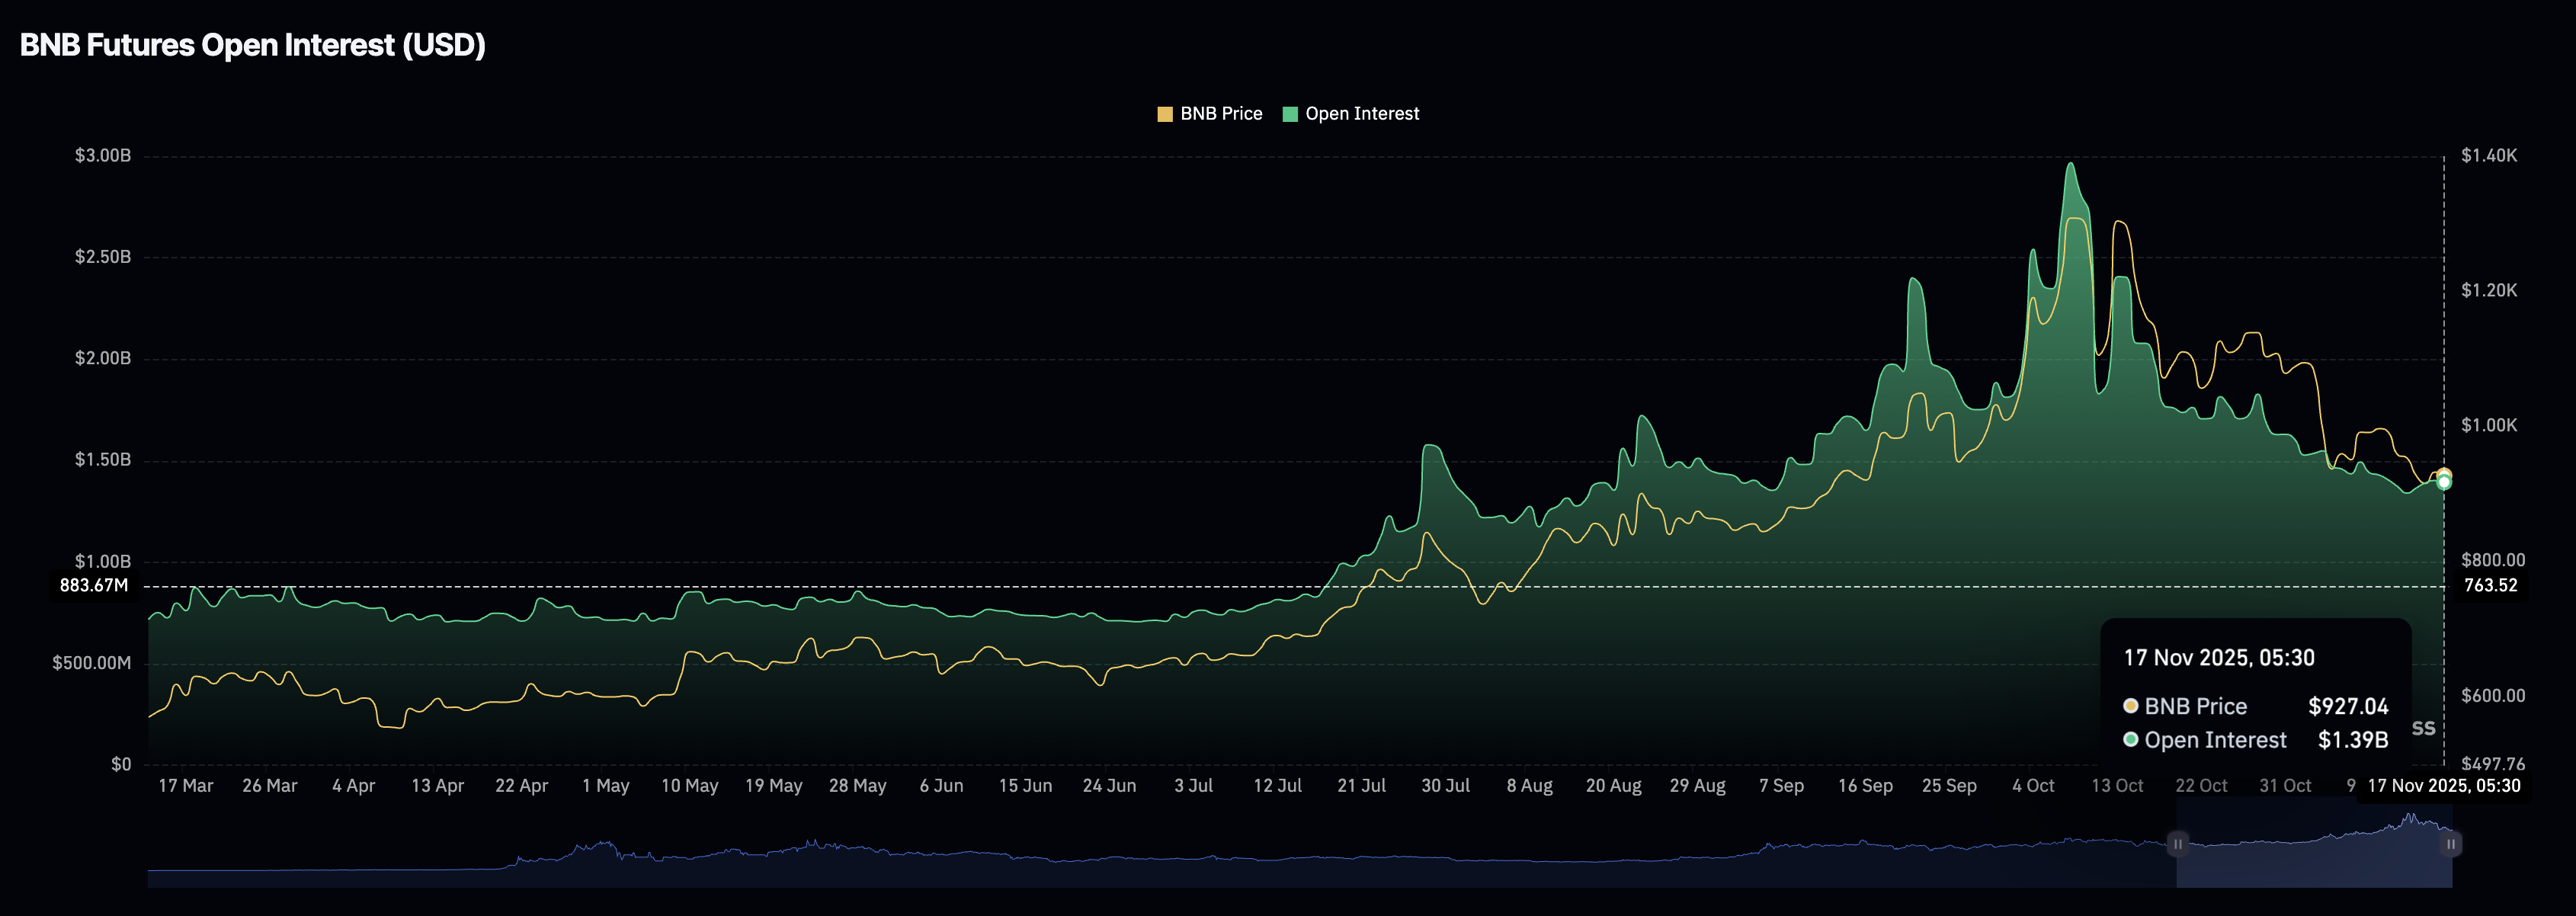
The retail interest in BNB stabilizes following weeks of risk-off sentiment. According to CoinGlass, after pulling back from $2.97 billion on October 8, the BNB futures Open Interest (OI) stands at $1.39 billion on Monday, signaling a lateral shift since last week as traders' sentiment regains strength.
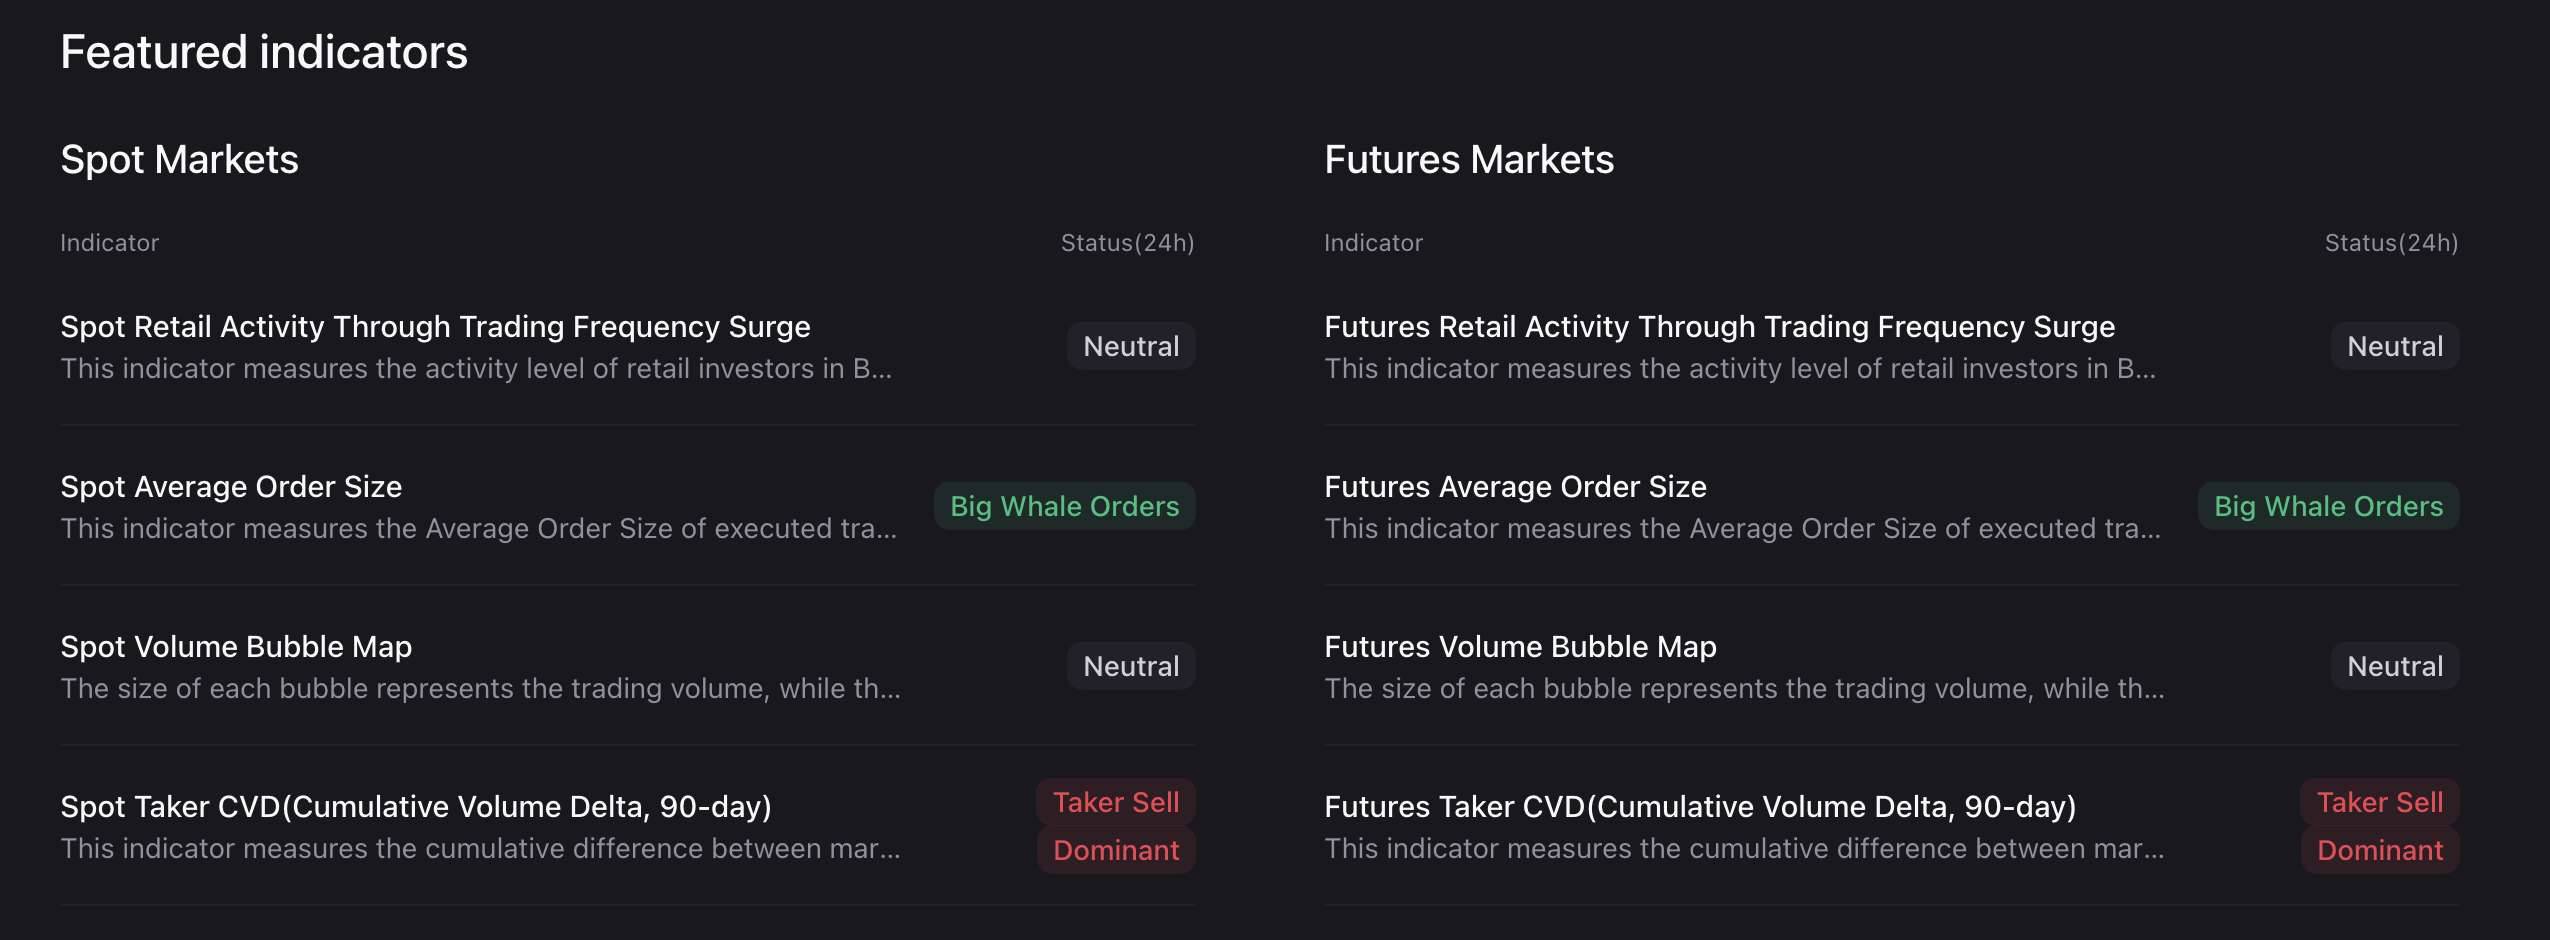
In line with the resurfacing interest, the CryptoQuant data show that large wallet investors are increasing the average order size on the futures market, indicating that whales are willing to increase their risk exposure.
However, the Cumulative Volume Delta (CVD) of BNB futures, which tracks the difference between market buy and sell volumes over the last 90 days, indicates a net taker sell dominance. This means that sellers are aggressively active, which could dissolve the short-term recovery.
Technical outlook: Will BNB surpass the resistance trendline?
BNB approaches a key resistance trendline formed by connecting the highs of October 13 and 27, which is close to the 50-period Exponential Moving Average (EMA) on the 4-hour chart, at $951. If the intraday recovery successively clears this average line, it could extend the breakout rally to the $1,000 psychological mark, close to the 200-period EMA.
The momentum indicators on the 4-hour chart remain neutral, as the Relative Strength Index (RSI) at 49 approaches the midline, indicating a decline in supply pressure. At the same time, the Moving Average Convergence Divergence (MACD) bounces off its signal line to extend the uptrend, indicating short-term bullish momentum.
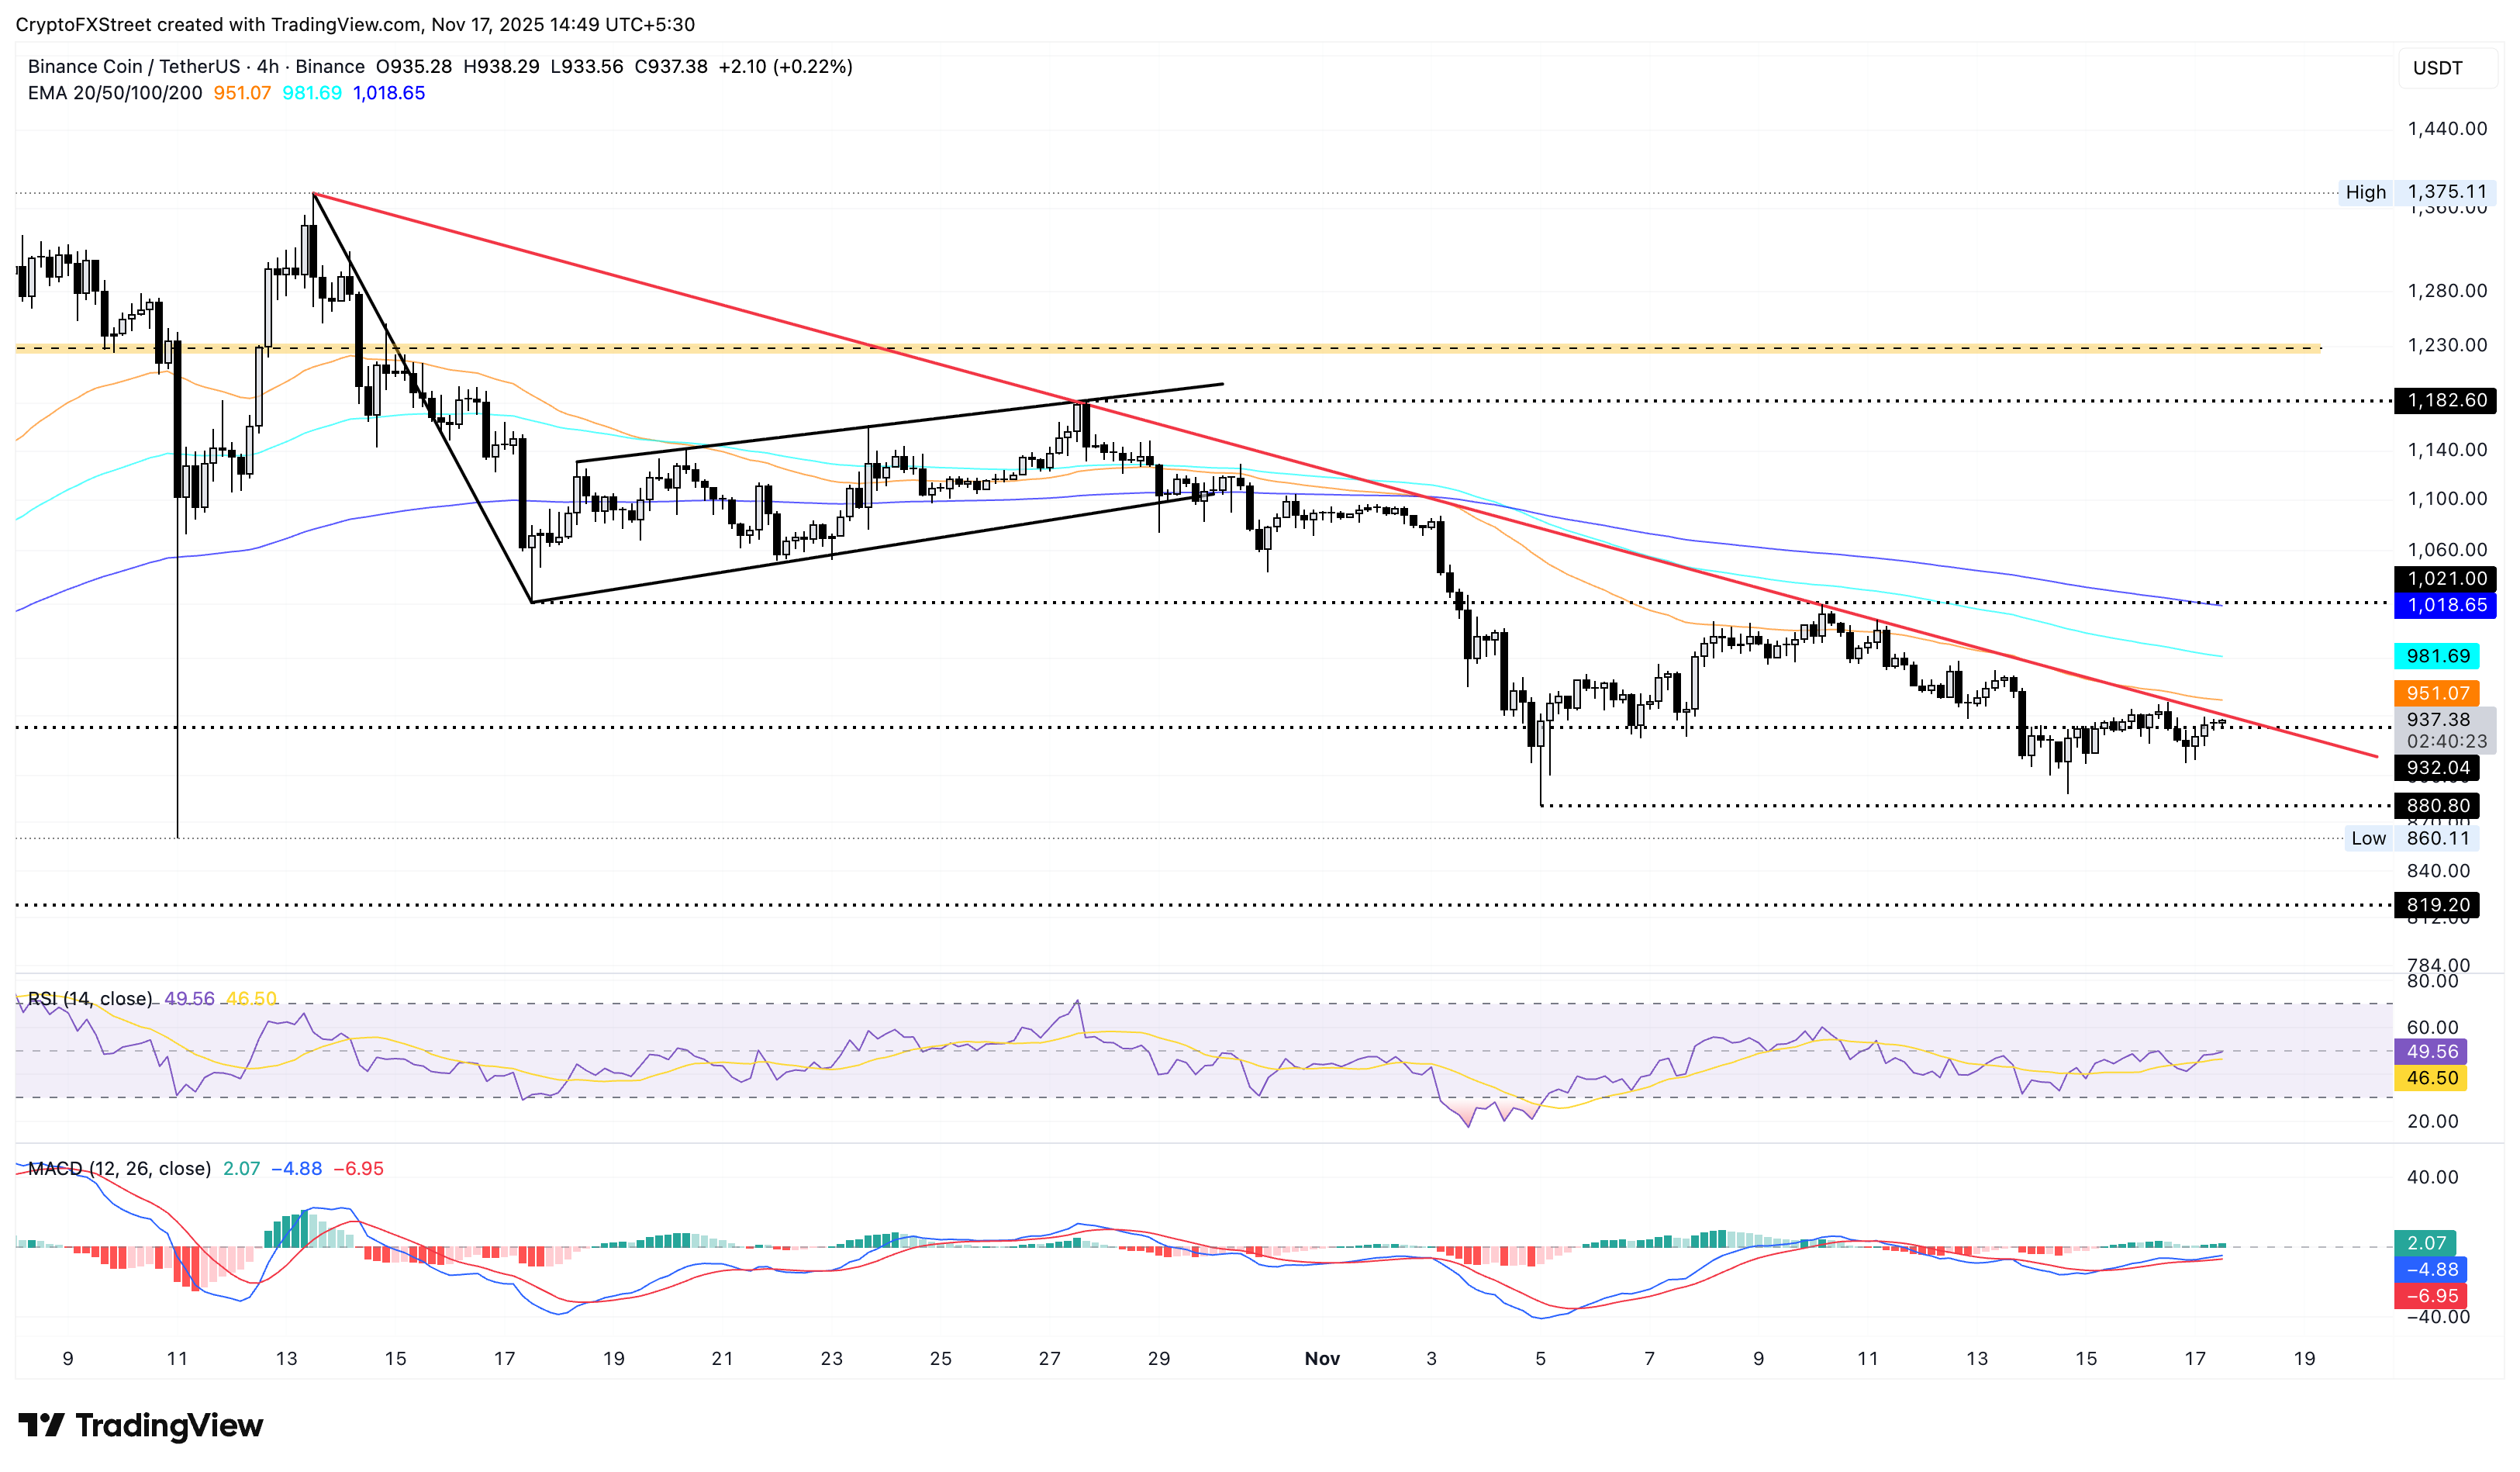
However, if BNB reverses from the trendline, it could threaten the November 5 low at $880.
Author

Vishal Dixit
FXStreet
Vishal Dixit holds a B.Sc. in Chemistry from Wilson College but found his true calling in the world of crypto.



