BNB Price Forecast: BNB extends gains as Nasdaq-listed CEA Industries $160 million bet fuels bullish outlook
- BNB price extends its gains on Monday after rallying 8% the previous week.
- Nasdaq-listed CEA Industries bought 200,000 BNB tokens worth $160 million, becoming the largest corporate BNB holder globally.
- The technical outlook suggests further gains toward its all-time high of $861.

BNB (BNB), formerly known as Binance Coin, trades above $820 at the time of writing on Monday, extending gains after an 8% rally last week. This surge is fueled by the announcement on Sunday that Nasdaq-listed CEA Industries (BNC) bought 200,000 BNB tokens worth $160 million. The technical setup suggests further gains are on the cards, with bulls aiming for its all-time high of $861.
BNB’s growing corporate adoption
Nasdaq-listed CEA Industries announced on Sunday that the firm had purchased 200,000 BNB tokens worth $160 million. The firm has become the largest corporate holder of BNB globally, after securing a $500 million private placement led by 10X Capital in partnership with YZi Labs, establishing the first BNB Treasury Company in the US.
“[The firm] plans to continue purchasing BNB until the initial treasury capital is fully deployed and may tap up to $750 million more (...) if fully exercised, total proceeds could approach $1.25 billion for additional BNB acquisitions,” said its press release.
This news announcement indicates a bullish outlook for the BNB token in the long term, as it increases exposure, growth, liquidity, and wider adoption. BNB price rose slightly on Sunday and continues to trade higher at the time of writing on Monday, above $820.
BNB Price Forecast: BNB bulls aiming for record highs
BNB price found support around its weekly level of $742 on Tuesday and rose nearly 7% in the next five days.
If BNB continues its upward trend, it could extend the rally toward its all-time high of $861.10 on July 28. If a successful close above this level occurs, BNB would enter in price discovery mode with bulls targeting the psychological level of $900.
The Relative Strength Index (RSI) on the daily chart reads 65, above its neutral value and below overbought conditions, indicating bullish momentum could extend further. The Moving Average Convergence Divergence (MACD) lines are about to flip into a bullish crossover that could further support the continuation of the recent uptrend.
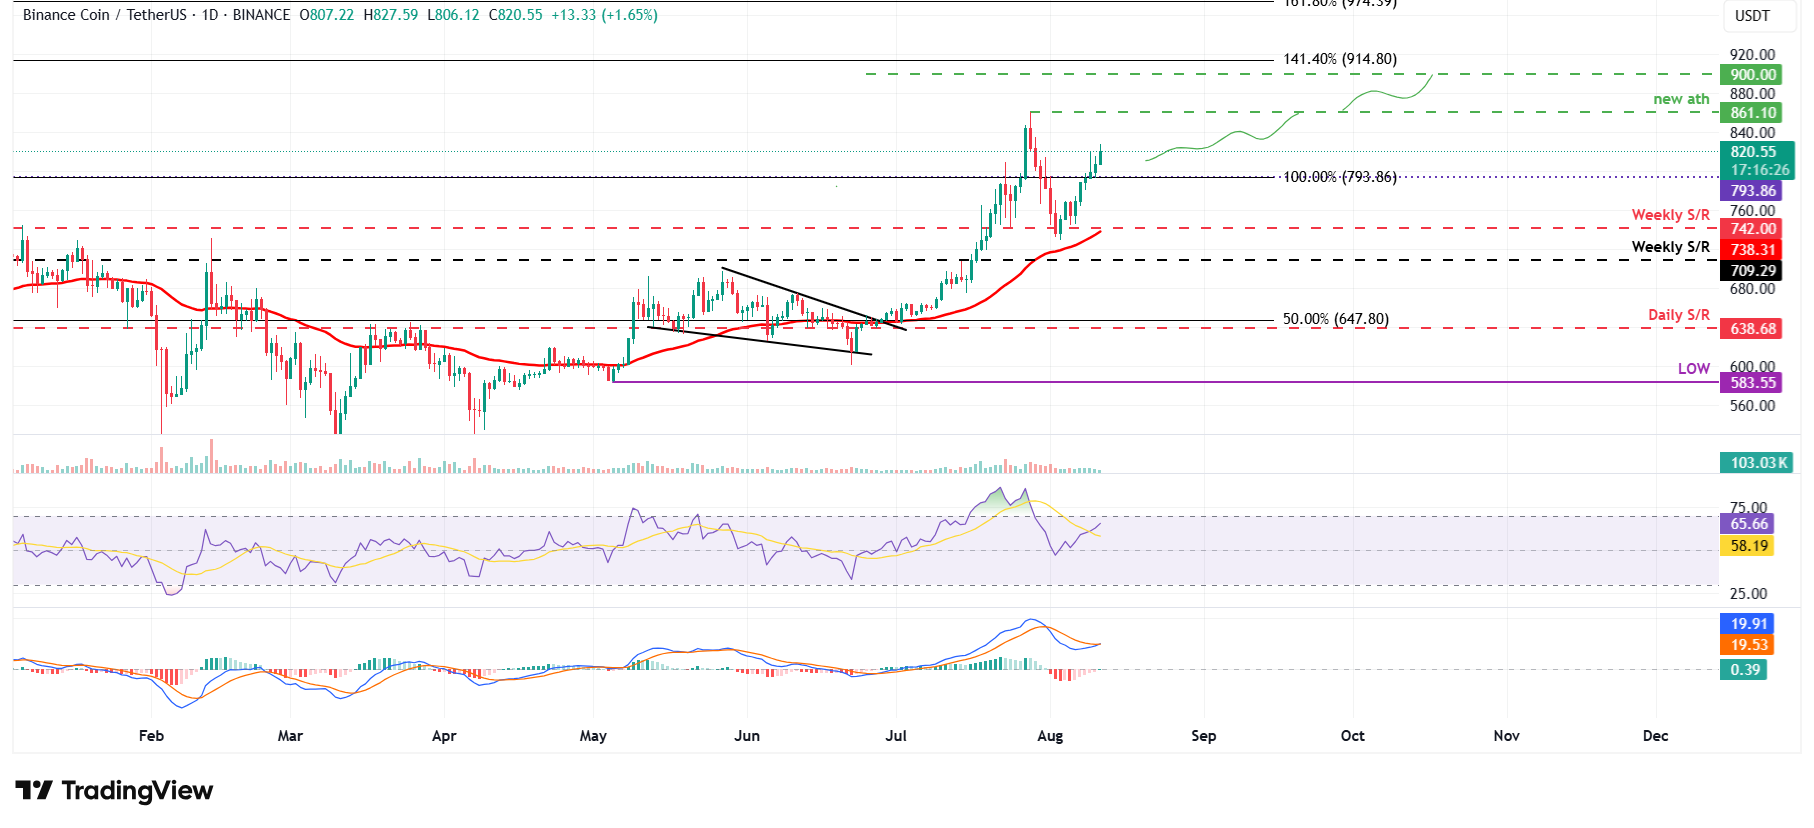
BNB/USDT daily chart
If BNB faces a correction, it could extend the decline to find support around its daily level at $793.86.
Author

Manish Chhetri
FXStreet
Manish Chhetri is a crypto specialist with over four years of experience in the cryptocurrency industry.




