Bittensor Price Forecast: TAO rally gains traction as retail interest returns
- Bittensor rally holds above $450, after four consecutive days of uptrend.
- The TAO futures Open Interest surge indicates a revival in traders’ interest.
- Technically, Bittensor stands at a crucial crossroads with bulls eyeing a potential breakout rally.

Bittensor (TAO) holds steady near $460 at press time on Wednesday, sustaining the 3% gains from the previous day. The Artificial Intelligence (AI) token eyes further gains on returning retail interest and heightened buying pressure.
Rising retail demand anticipates further gains
The traders’ sentiment around Bittensor in the derivatives market has returned to heightened levels after the flash crash on Friday. CoinGlass data shows that the TAO futures Open Interest (OI) stands at $338.59 million, with a 28% increase over the last 24 hours. This double-digit rise refers to an increase in the notional value of outstanding futures contracts, signaling that traders are increasing risk exposure.
At the same time, the volume has increased by nearly 59% reaching $2.34 billion, indicating a bullish tilt.
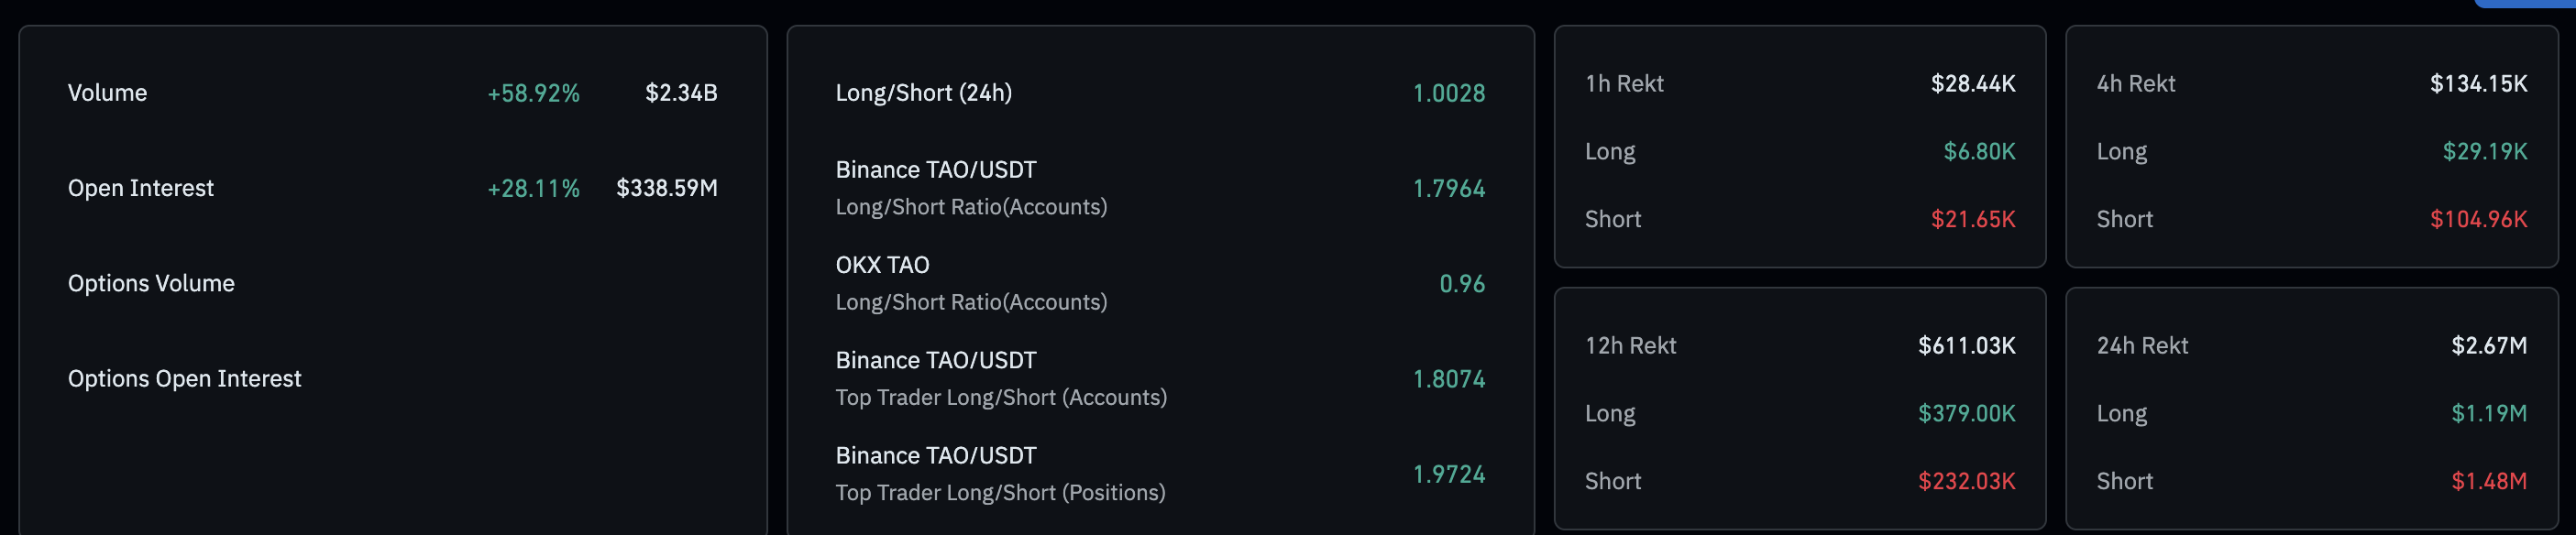
Bittensor derivatives data. Source: CoinGlass
Bittensor rally hits a crucial crossroads
Bittensor trades above the positively aligned 50-day, 100-day, and 200-day at $347, $350, and $359, respectively, suggesting a bullish trend in motion. The AI token rally driven by the CEO of Digital Coin Group (DCG) and Yuma Barry Silbert, who recently announced flagship funds on Bittensor’s subnet tokens, has reached the 50% Fibonacci retracement level at $458, retraced from the $748 high of December 6 to the $167 low of April 7. This level has kept the TAO price intact in late January 2025, making it a key resistance level.
A decisive close above this level could face opposition from the 61.8% and 78.6% Fibonacci retracement levels at $526 and $624, respectively.
Technically, the indicators on the daily chart flash rising bullish potential as the Relative Strength Index (RSI) at 72 enters the overbought zone, signaling heightened buying pressure..
Additionally, the Moving Average Convergence Divergence (MACD) holds a steady rise with its signal line, indicating a surge in bullish momentum.
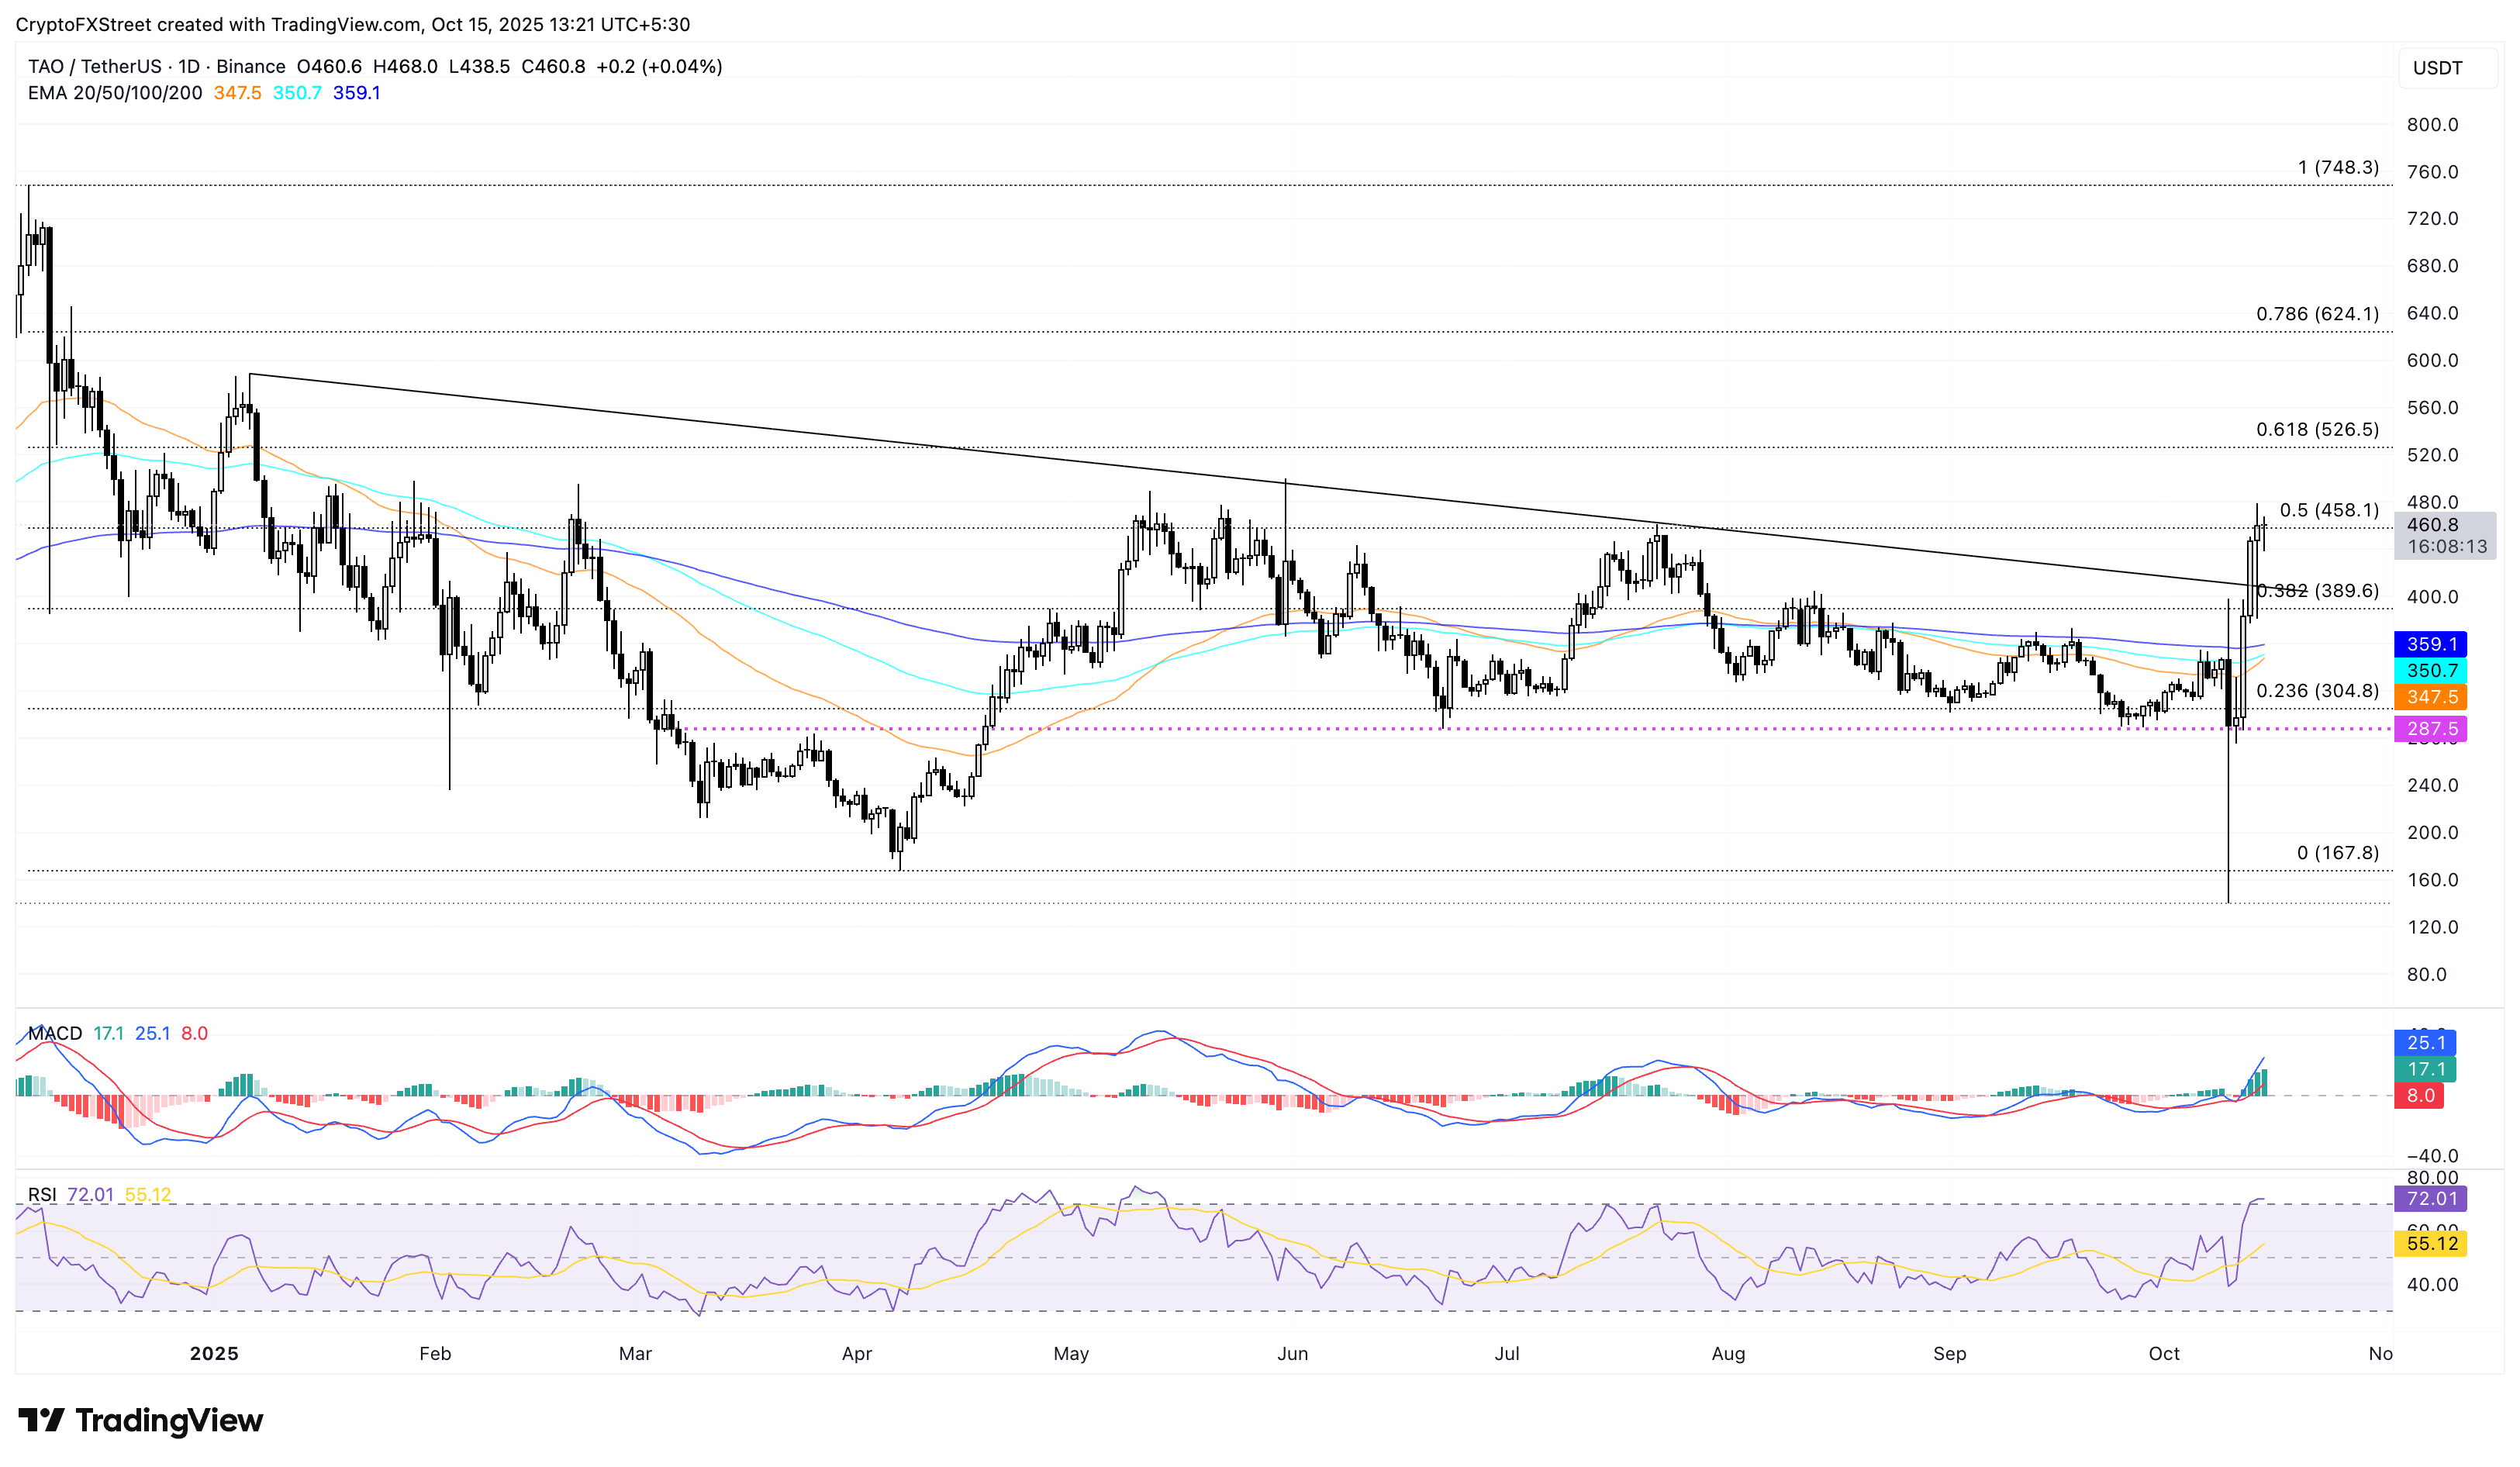
TAO/USDT daily price chart.
Looking down, if TAO reverses from the $458 level, it could retest the 38.2% Fibonacci retracement level at $389, threatening the $400 psychological level.
Author

Vishal Dixit
FXStreet
Vishal Dixit holds a B.Sc. in Chemistry from Wilson College but found his true calling in the world of crypto.