Bitcoin’s uptrend is still intact – 164K is still our target

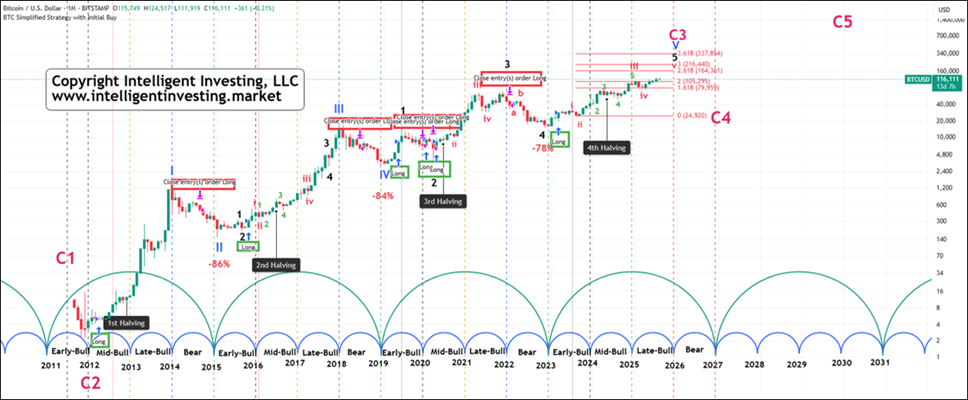
For those new to our updates and as a reminder to regular readers, we have been bullish on Bitcoin (BTCUSD) since at least mid-September 2023, when it was trading at around $26K. Back then, we presented the four phases of BTC’s four-year cycle. See Figure 1 below. Besides, we forecasted for 2024 and beyond, that
“Based on BTC’s past cycles, made up of four more minor phases, it is currently in the 'Mid Bull' phase and thus close to the next Bull run, which can target $100-200+K by the end of 2025.”
Fast forward, and BTC reached its latest all-time high (ATH) on August 14 at $124,532. So far, so good. Based on Fibonacci extensions for the red wave five (W-v), the ideal target zone of $164-216K has not been reached yet, while there’s still more than three months left before the current cycle can be considered over. Additionally, our trading alert service for the long term signaled to buy BTC on March 31, 2023, with an entry at $28,476 (green square), and it has yet to give a sell signal. When that occurs, we know the current run is over, as seen with the sell signals (red squares) in 2014, 2018, and 2022.
Figure 1. Bitcoin’s monthly price chart with our preferred EW count, four-phases cycle, and trading system signals
Besides the Elliott wave count, cycles, and trading system signals, we also notice that Bitcoin has remained in an uptrend since it bottomed out late in 2022. See Figure 2 below. We included the On Balance Volume (OBV) indicator because every time it broke above its downtrend line, a new uptrend started (green arrows). It recently did so again (pink arrow).
Figure 2. Bitcoin’s uptrend since late 2022
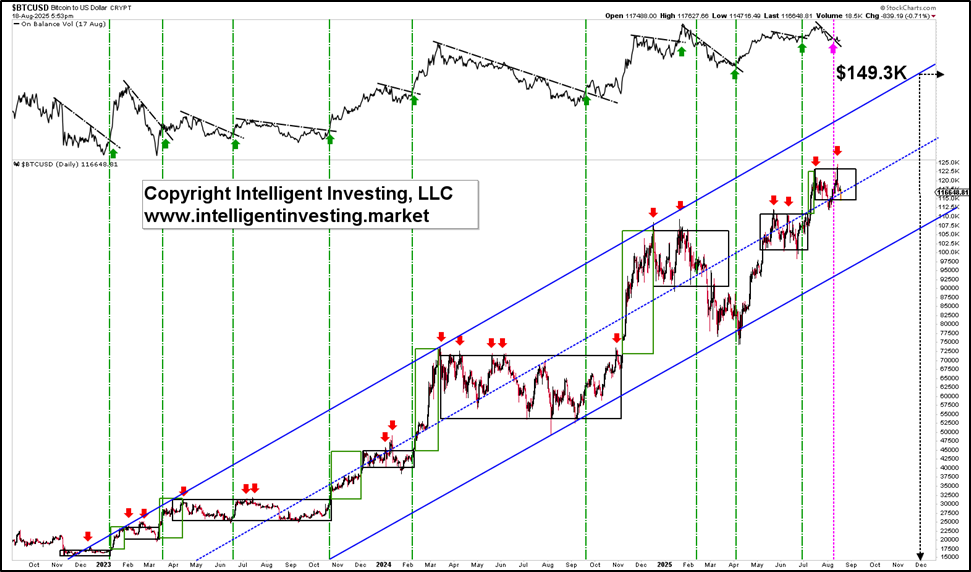
We also added the time bitcoin has spent going sideways (black squares) and rallying (green squares). It follows that BTC has spent about 28 months in consolidation patterns and rallied for only ~6 months. Why is that important? Because it means 1) you snooze, you lose, and 2) don’t get shaken out during times of low volatility.
Lastly, the red down-pointing arrows indicate that each consolidation results in false breakouts. We just experienced one on August 14. Only the February-March consolidation of this year was resolved lower, but Bitcoin stayed within its uptrend channel and has rallied multiple times to new ATHs since then. Therefore, follow the trend, the four-year cycle, the Elliott Wave, and our long-term trading system signal. None of these has yet signaled that the top is in.
Additionally, assuming “THE” peak on December 1, the blue trend channel is then around $149.3K, which is still 28% above current levels and brings us close to the ideal $164K target.
So, although we haven't gotten every twist and turn right since then—which is impossible anyway—we’ve consistently emphasized a bullish outlook for nearly two years, keeping our premium newsletter members on the right side of the trade, resulting in over 400% gains. At this point, we remain bullish.
Author

Dr. Arnout Ter Schure
Intelligent Investing, LLC
After having worked for over ten years within the field of energy and the environment, Dr.


