Bitcoin Weekly Forecast: What are the odds for a 2022 bull run
- Bitcoin price shows signs of a strong rebound as it hovers around the $40,000 level.
- On-chain metrics are hinting at a massive bullish outlook from a long-term perspective.
- For the short-to-mid term scenario, BTC is likely to trigger a run-up to $50,000.

Bitcoin price is positioned at a level that is likely to result in a quick run-up to key levels. The on-chain metrics are also suggesting the possibility of a spike in buying pressure that could trigger a full-blown bull run if certain hurdles are overcome.
Bitcoin price and bullish technicals
Bitcoin price has crashed 17% since April 4 and is currently bouncing off the 200 three-day Simple Moving Average (SMA) at $39,506. This downswing was a major bearish event as BTC dropped below the bullish crossover between the 50-day and 100-day SMAs.
The Bitcoin price action from January 22 to March 15 has set up three higher highs and two higher lows, which when connected using trend lines, results in an ascending parallel channel formation.
As seen, the swing lows have breached the 200 three-day SMAs, and the bodies of these candlesticks have closed above them. Therefore, investors can expect a minor downswing with a quick recovery before making a U-turn.
A bounce off the 200 three-day SMA is likely to trigger a full-blown reversal that will push BTC to overcome the 50-day, 100-day SMAs and tag the yearly open at $46,198. This move will take a massive surge in buying pressure to manifest. Hence, the upside for BTC could be capped at the yearly open but in some cases, the big crypto could retest the 200-day SMA at $48,169.
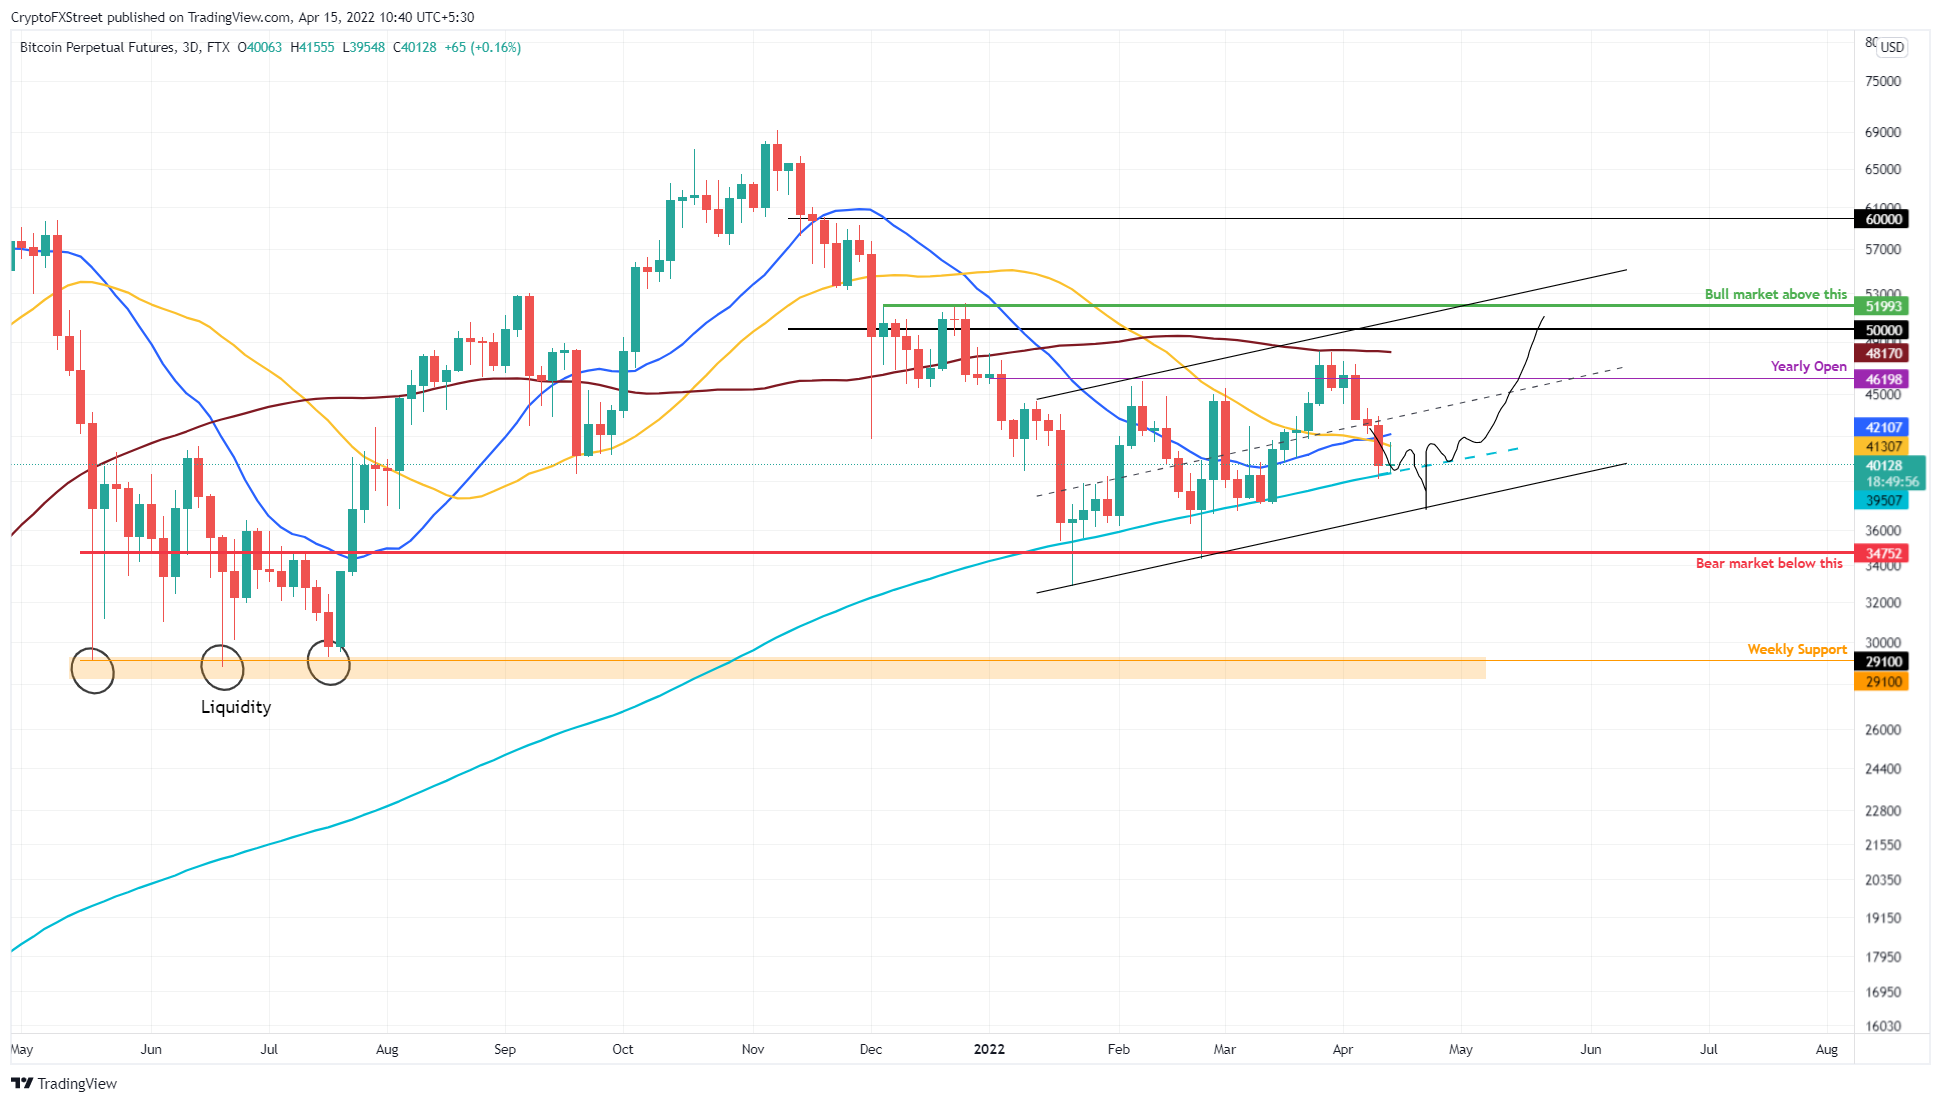
BTC/USDT 1-day chart
While technicals might be suggesting only a minor uptrend for Bitcoin price, on-chain metrics are indicating a far brighter future. Two of the most overly bullish indices are - supply on exchanges and net exchange position change.
The first indicator tracks the number of BTC held on centralized entities and can serve as a guestimation of the selling pressure if things go wrong. Typically, a spike in this metric often leads to a sell-off. However, for Bitcoin, this indicator has been on a downtrend since March 2020.
The total number of BTC held on exchanges has dropped to 1.91 million, a level last seen on December 6, 2018, indicating that the investors are confident in the performance of Bitcoin price.
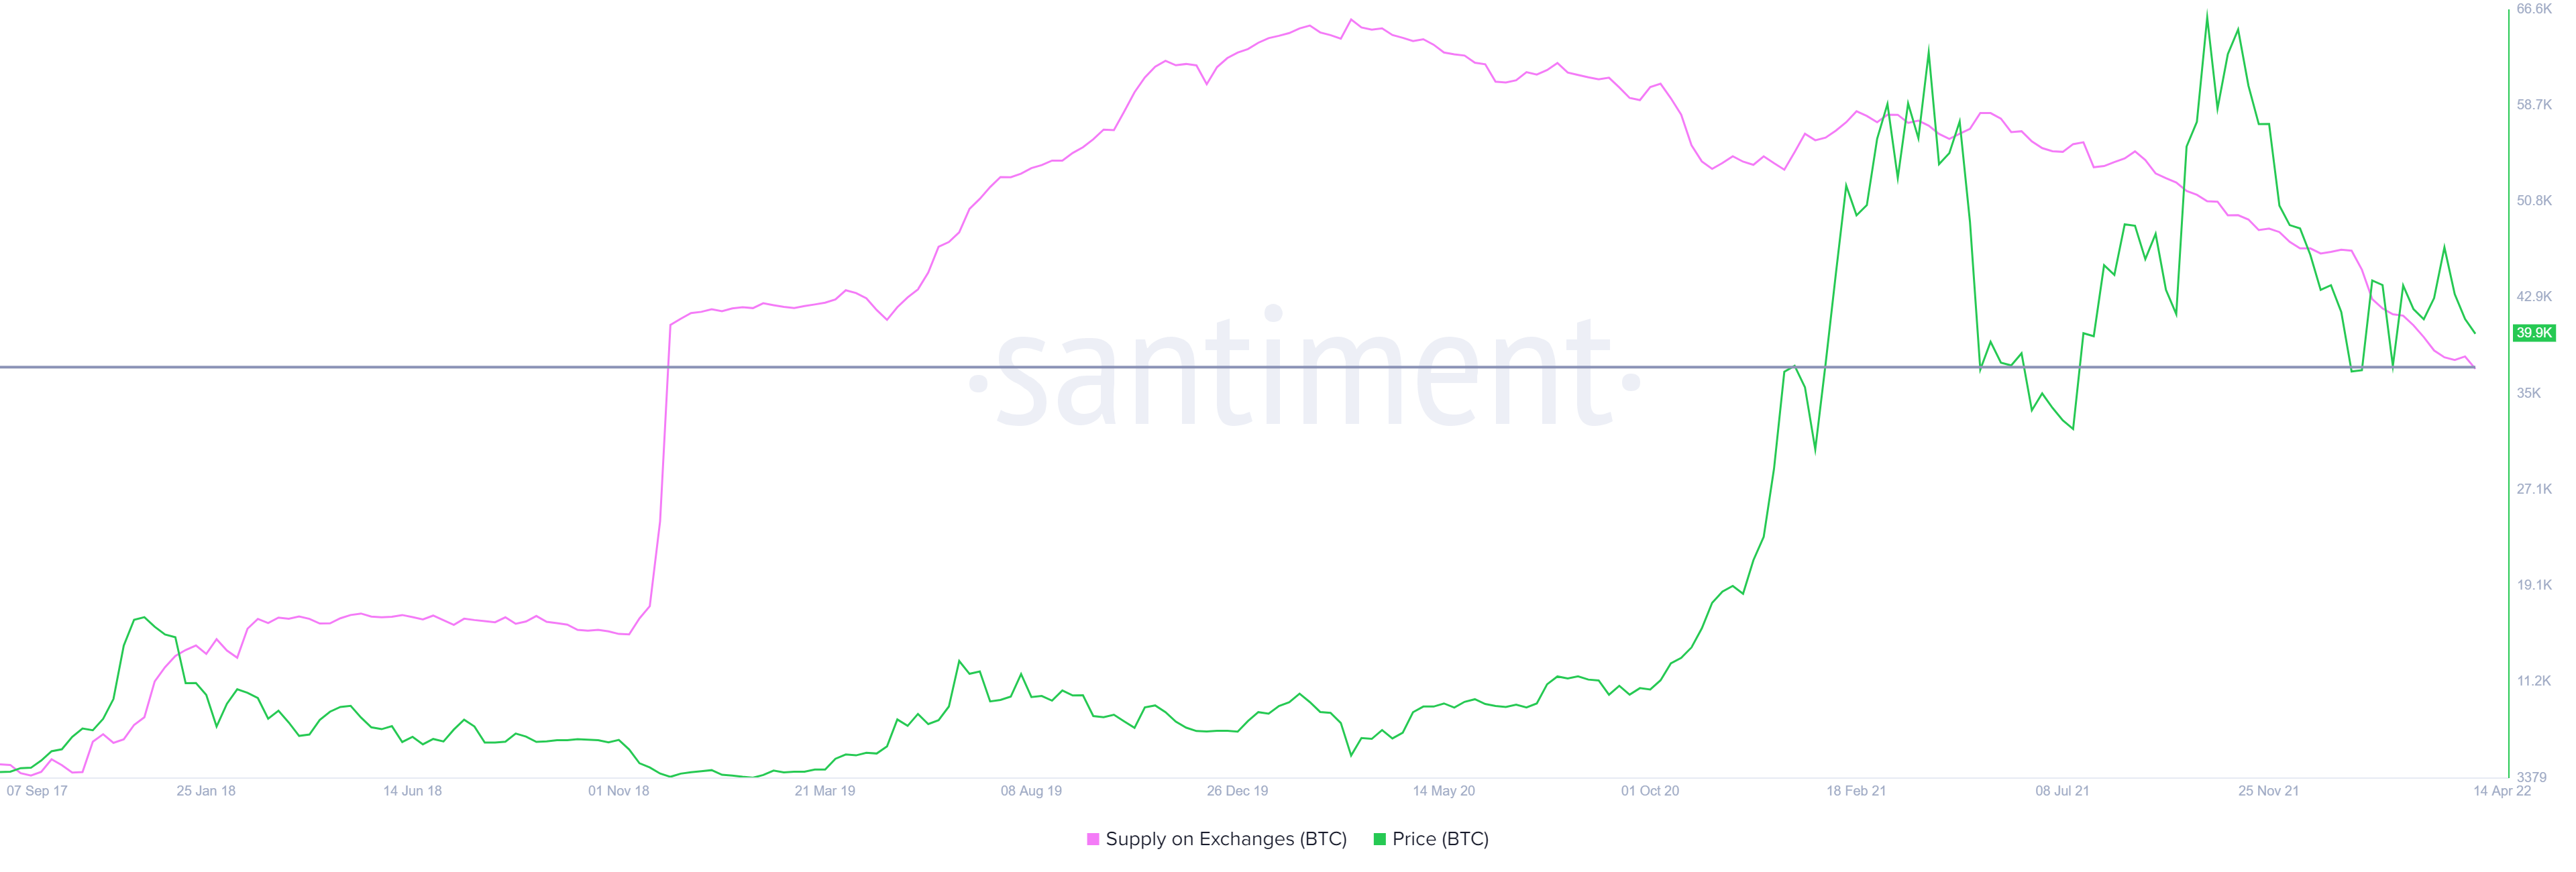
BTC supply on exchanges
Further building on the bullishness is the exchange net position change indicator, which tracks the 30-day change in Bitcoins held on exchange wallets. Since March 2022, nearly 100,000 BTC have left exchanges. Moreover, such an extent of outflow was only witnessed five times in the decade-long history of BTC.
All of this indicates that investors are betting on better performance of the big crypto over a longer timeframe.
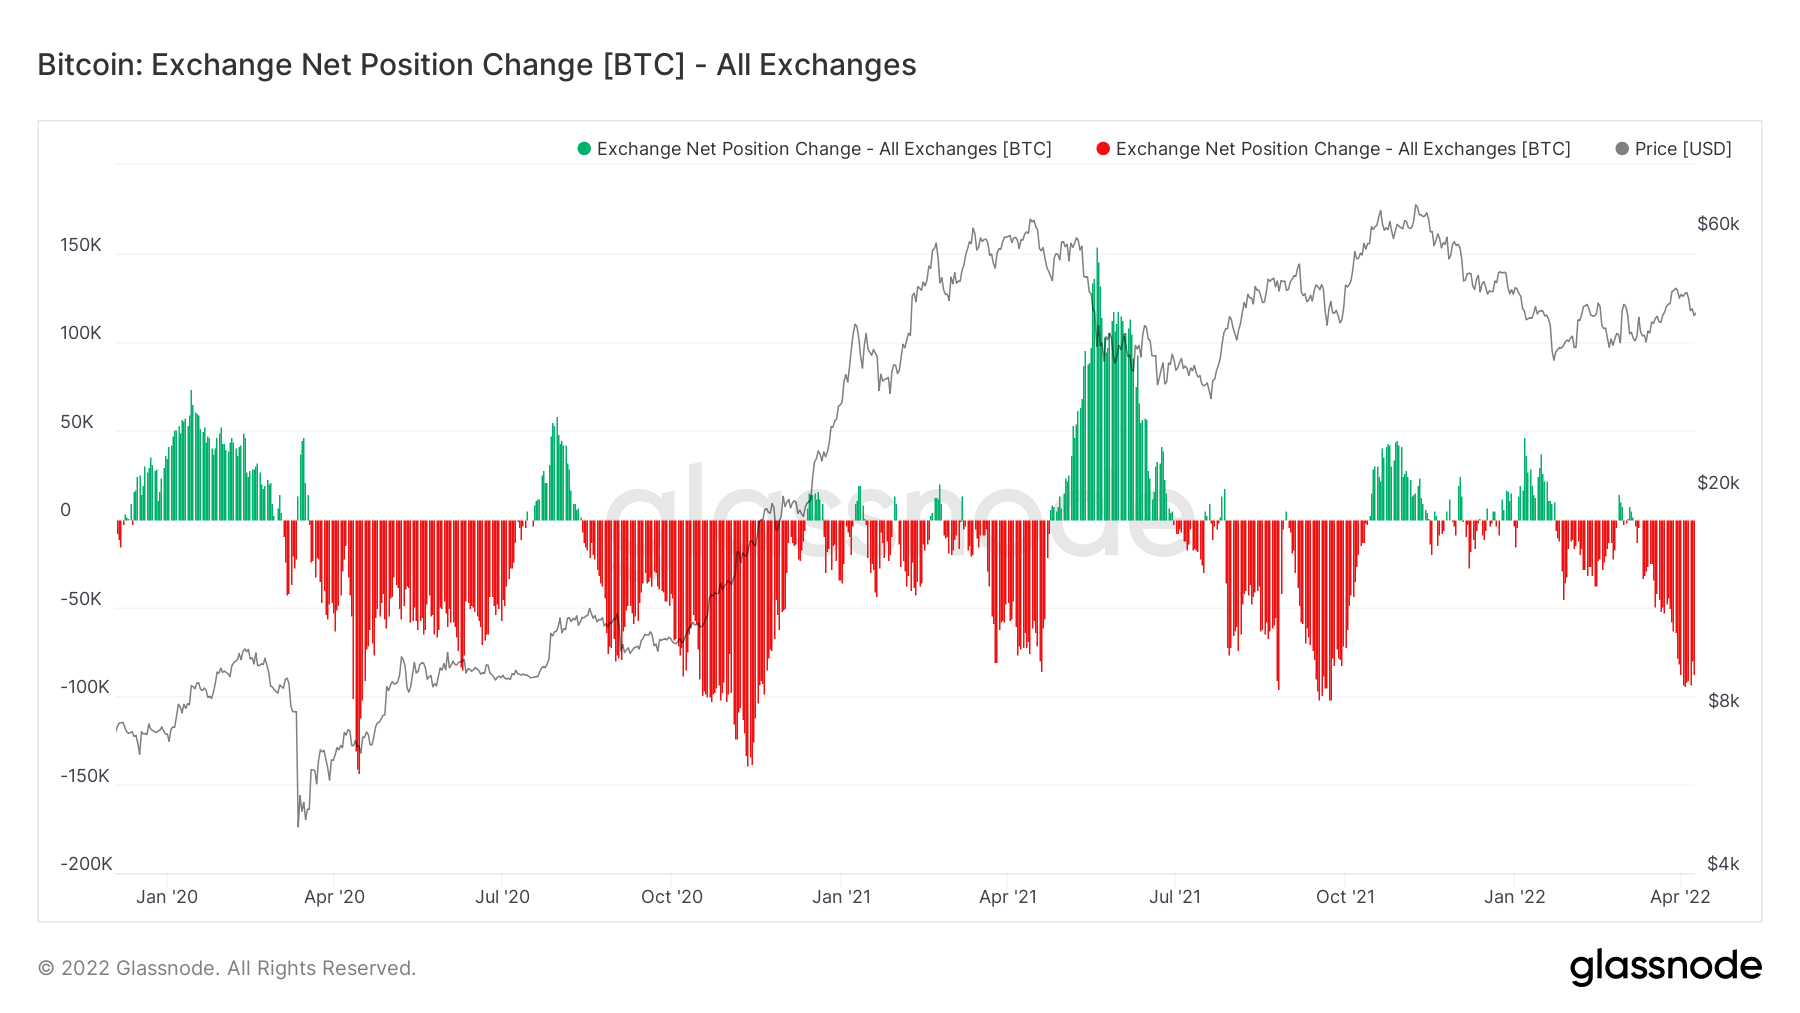
BTC exchange net position change
Revealing a similar bullish outlook for Bitcoin price is the supply distribution by the balance of addresses. This index shows that there has been a net increase in whales holding between 100,000 and 1,000,000 BTC from 2.93% in December 2021 to 3.47% as of this writing. This uptick in accumulation is the most apparent indicator suggesting the intent of institutional investors.
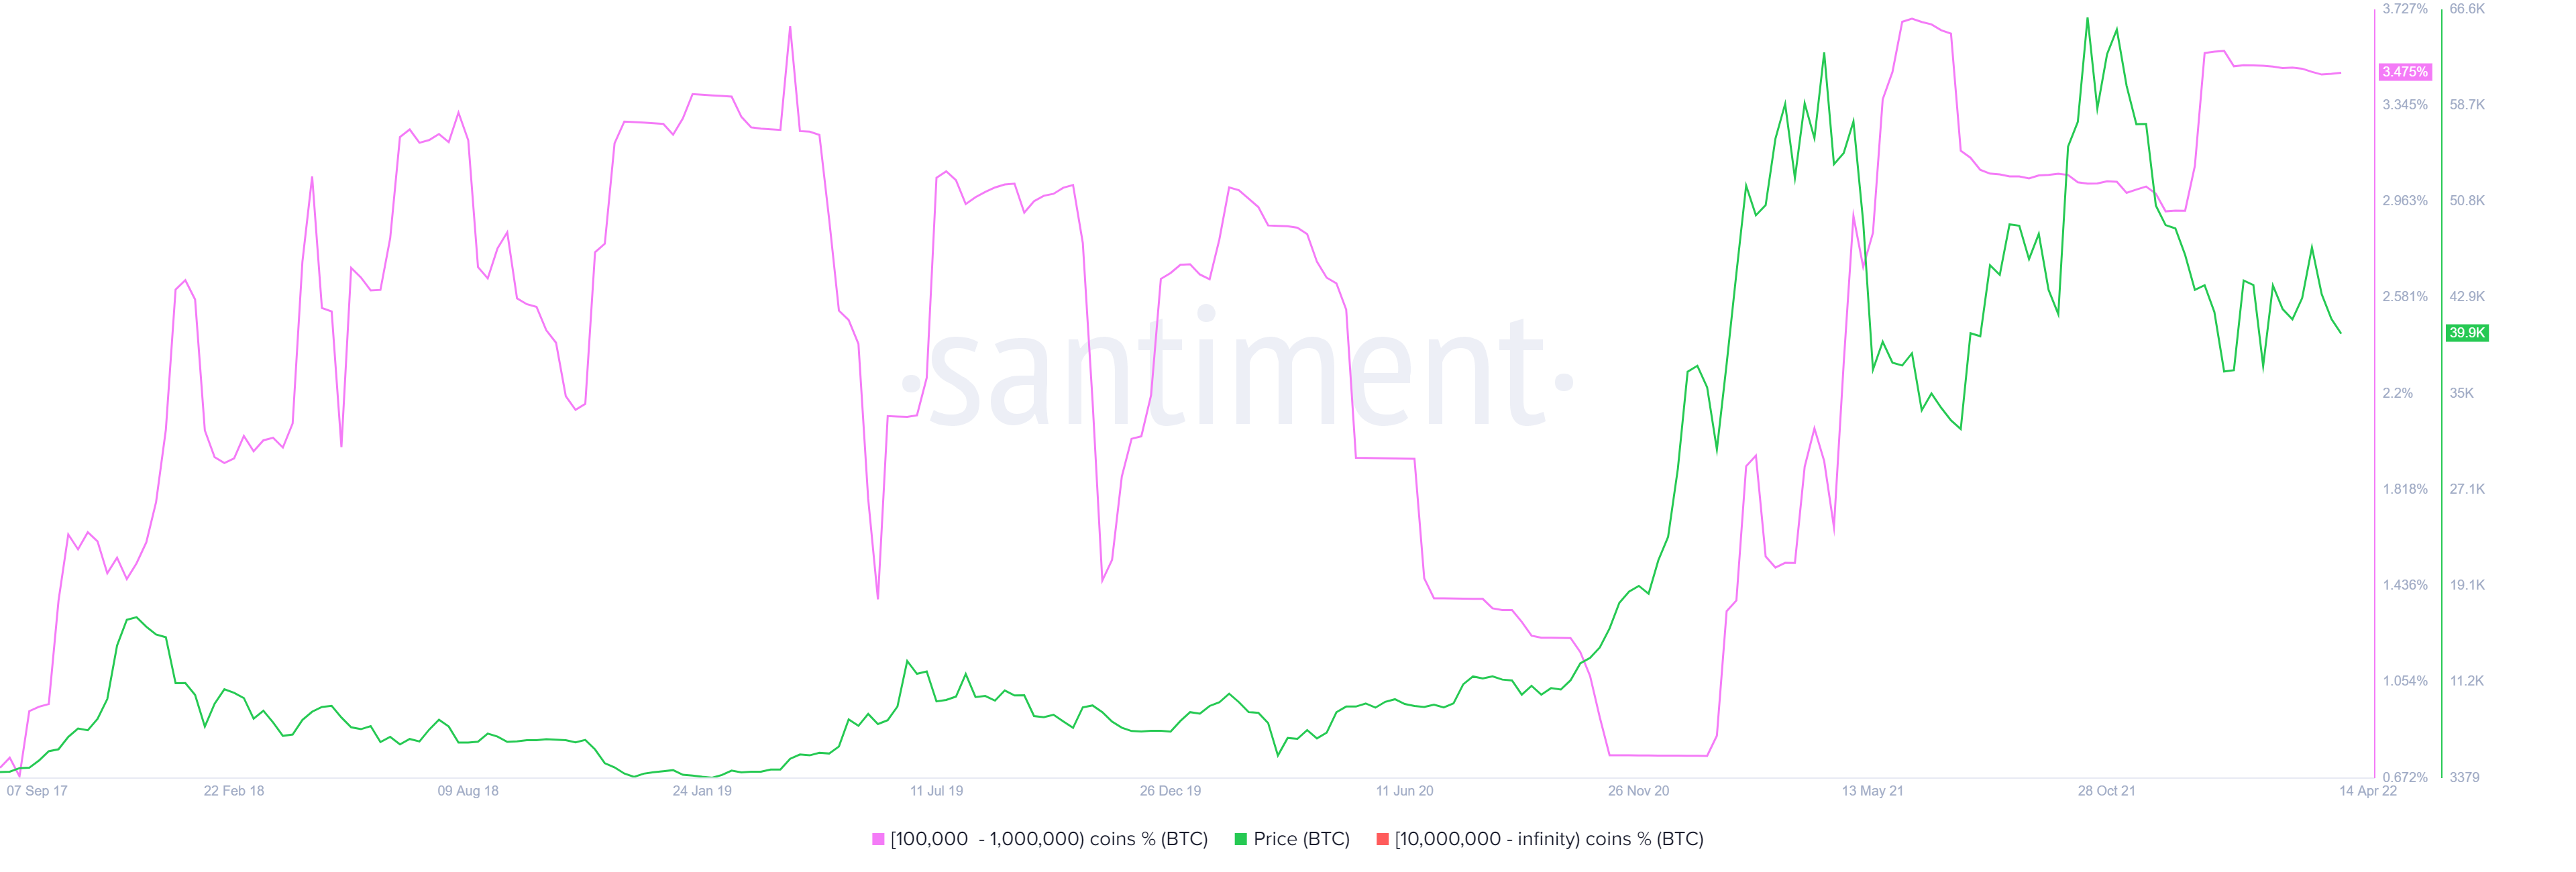
BTC supply distribution chart
A popular on-chain analyst with the screen name ‘TechDev’ tweeted that the market has been in a year-long retracement and that an impulsive is likely. He explains that major buy signals are popping up on different fronts.
The first and the most obvious indication is the bullish flip and retest of the 100-day Moving Average (MA). Interestingly, a similar setup was seen before the start of the 2017 bull rally, adding weight to the recent signal.
Moreover, the altcoin market cap has also moved above the Exponential Moving Average (EMA) ribbon and is currently retesting it. Again, a similar setup was seen in 2017, before altcoins saw a massive rally.
Lastly, the dollar index (DXY) is also approaching a local top, which was a familiar structure seen before the start of the 2017 run-up. Combined with the hands-on approach of the Federal Reserve in hiking the interest rates, there is bound to be a retracement in DXY, which will pave the way for capital rotation into hard assets like Bitcoin.
TechDev’s case for a bull run
All in all, Bitcoin price seems to be positioned perfectly to kick-start a massive bull rally and on-chain indicators are actively supporting this outlook. However, a daily candlestick close below the $34,752 support level will make sure that BTC will continue heading lower. Such a development could trigger a crash to look for stable support levels. Therefore, investors need to be aware of the sell-stops present below the $30,000 level as BTC might crash lower to sweep this liquidity before triggering a 2022 bull rally.
Author

Akash Girimath
FXStreet
Akash Girimath is a Mechanical Engineer interested in the chaos of the financial markets. Trying to make sense of this convoluted yet fascinating space, he switched his engineering job to become a crypto reporter and analyst.