Bitcoin Weekly Forecast: There’s a BTC price crash looming
- Bitcoin price intraday volatility seems to have dried up as it hovers around the $30,000 psychological level.
- From a macro perspective, the bearish trend persists and explores the possibility of a crash to $11,865.
- The bearish thesis will face invalidation if BTC produces a daily candlestick close above $52,000.

Bitcoin price is at a point in its journey through the bear market where investors are split into camps that are expecting a relief rally, a continuation of the crash and a full-blown bull rally. Interestingly, none of the aforementioned theses is wrong per se.
Bitcoin price and macro bearishness
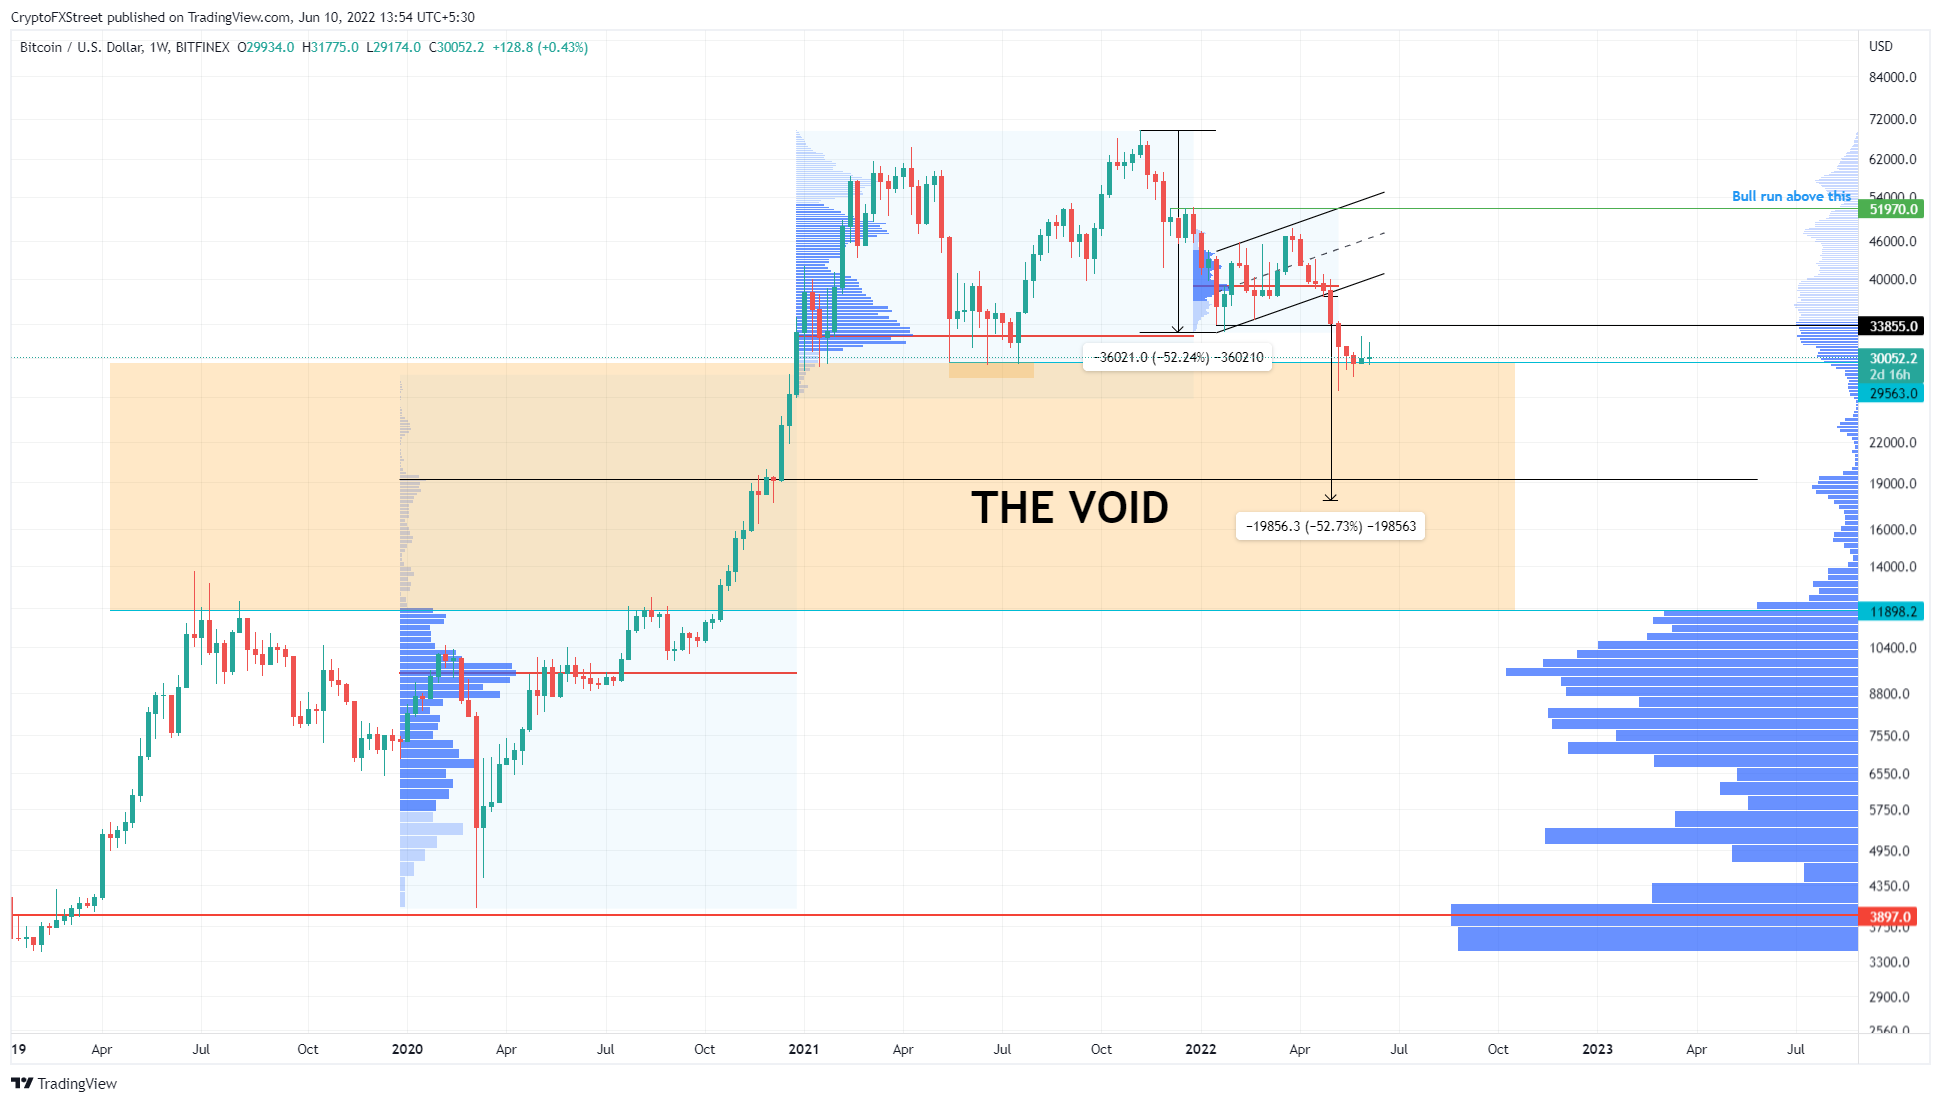
Bitcoin price has broken out of the bear flag pattern formed between November 8, 2021, and March 28, 2022. This technical formation contains two distinctive parts that serve as identifiers - flagpole and flag.
Since its all-time high at $69,000 BTC has crashed 61% to create the flagpole. The consolidation that followed this sudden nosedive was in the form of higher highs and higher lows, known as the flag.
On May 5, Bitcoin produced a daily candlestick close below $37,660, indicating a breakout. The target for this technical pattern is obtained by adding the flagpole’s height to the breakout point, which reveals a target of $17,803.
So far, BTC has fallen 22% of the way to its target and is currently bouncing off the $29,563 support level.
Additionally, the weekly chart shown below contains the separate volume profiles for 2020, 2021, and 2022. But the most fascinating data point is that barely any volume was traded as Bitcoin price rallied 556% between September 7, 2020, and April 12, 2021.
This sudden move created a void in volume that currently extends from between $11,891 and $29,424. Often, such inefficiencies in volume profiles are eventually filled as the underlying asset’s price reverses to the mean.
Bitcoin price has recently tagged the upper end of this void and is consolidating above it. A breakdown of this level, whenever it happens, will result in a crash to fill the aforementioned inefficiency.
However, a closer observation reveals that there seems to be a support level at $19,252, where the volume profile bumps out a little. Interestingly, the bear flag target is a few thousand dollars away from this level, reinforcing this zone as a potential downside target.
If the selling pressure is heavy, however, the bleed could extend to $11,891, bringing the total loss to 60% from the current level.
BTC/USDT 1-day chart
As reported earlier, the $19,252 level is significant to Bitcoin price not just from the volume profile thesis but for other reasons too. Since multiple scenarios are projecting a crash to the same level, investors can speculate that a macro bottom could form here.
Another possibility investors need to consider is that a relief rally could take Bitcoin price to $35,000 initially, before a sudden crash to $19,252 or $11,898 begins.
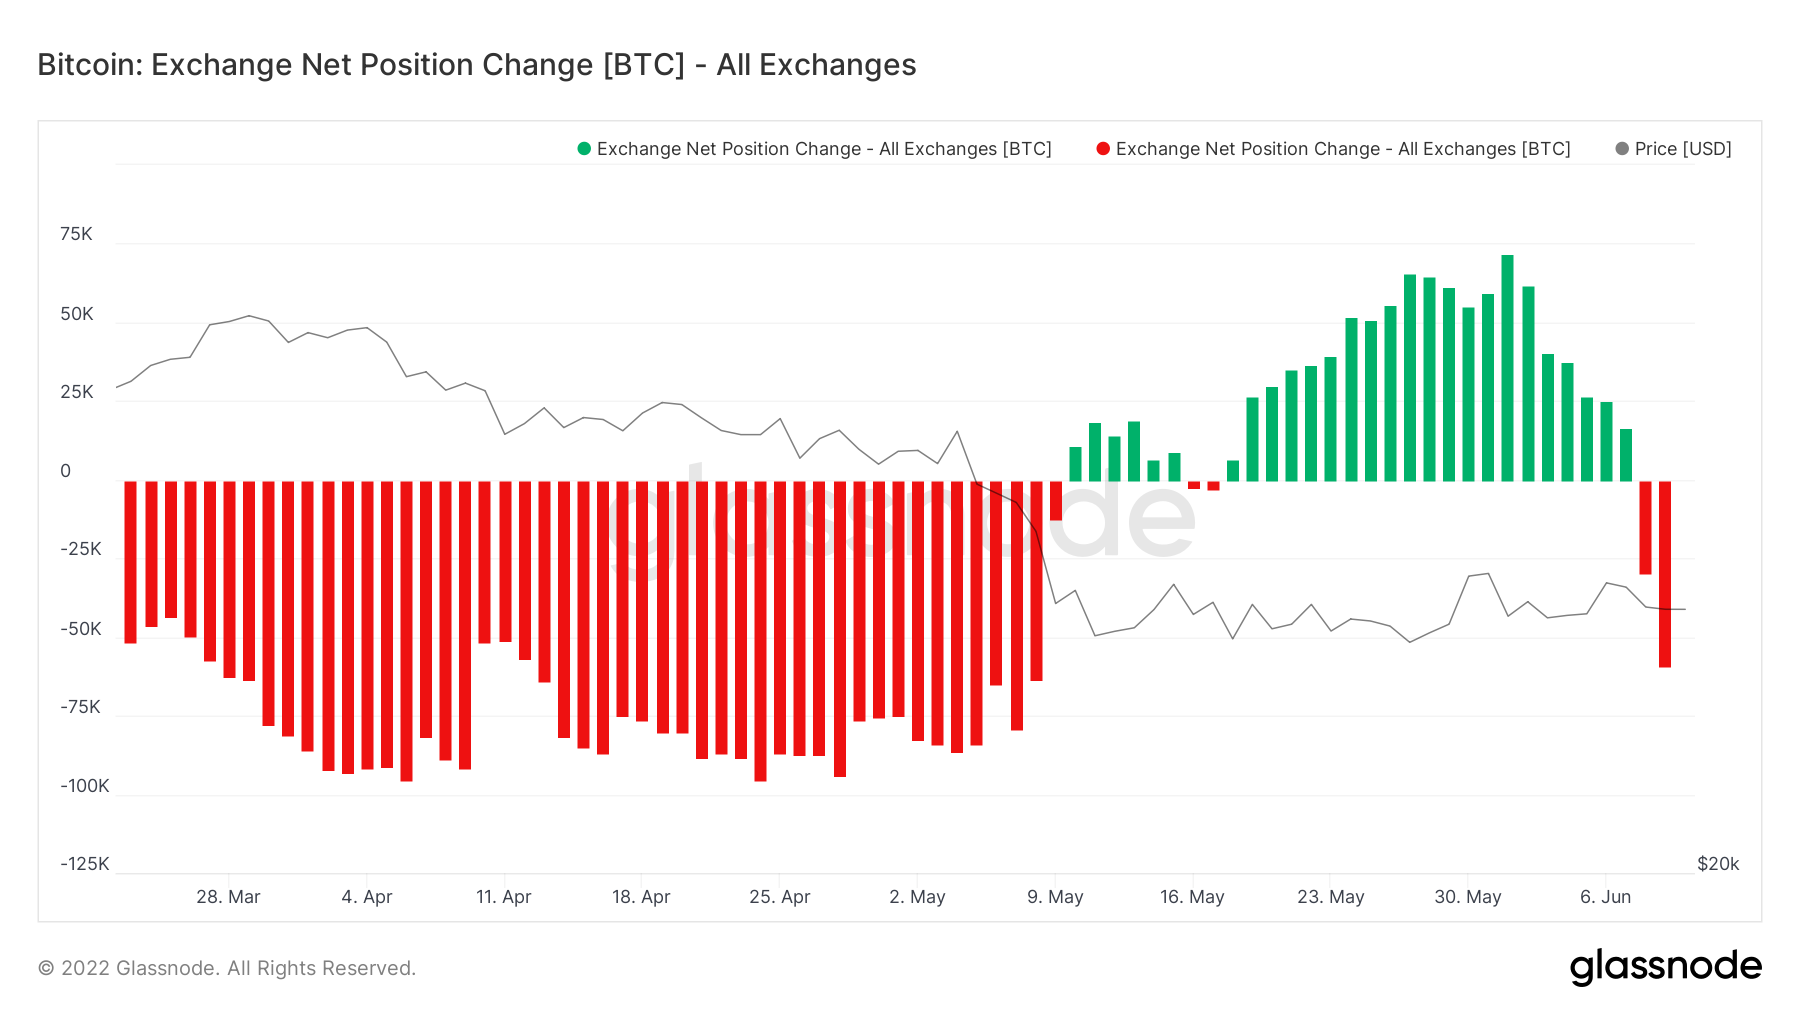
A look into Glassnode’s exchange net position change metric reveals that the first week of June saw inflows of up to 71,700 BTC into exchanges. This spike reveals actually reveals a lack of confidence amongst investors, who moved their BTC onto platforms that would then allow them to sell more easily in case a massive sell-off occurs.
So far, during the second week, however, the situation has changed with -56,100 in outflows, that has revealed a flip of that narrative into one that is mildly bullish. If this trend continues, the probability of a move to $35,000 increases.
BTC exchange net position change
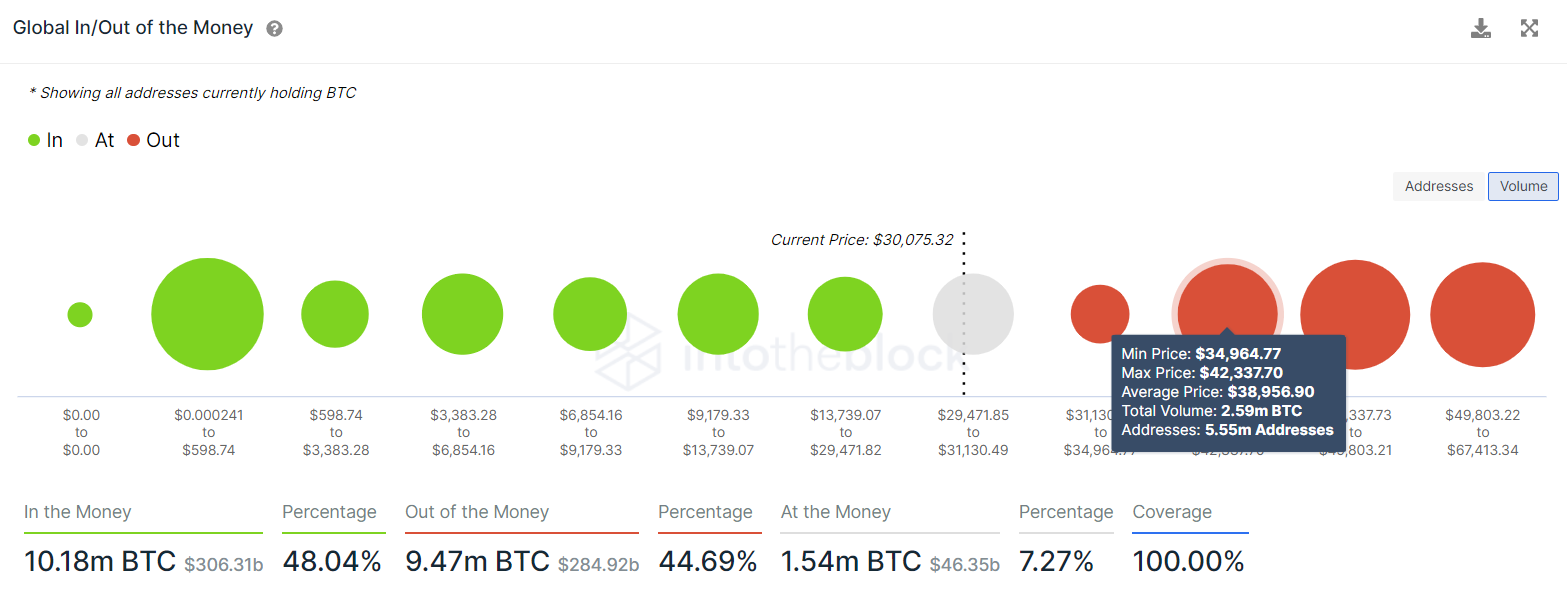
The transaction data for Bitcoin price from IntoTheBlock’s Global In/Out of the Money (GIOM) model reveals that a significant resistance barrier extends from $34,964 to $42,337. Roughly 5.55 million addresses that purchased 2.59 million BTC are “Out of the Money.”
If Bitcoin price heads up to this level, the selling pressure from market participants trying to break even will increase, indicating that a relief rally could form a local top around the average price at $38,956.
BTC GIOM
Hence, investors need to be careful with their investments and not fall prey to emotions or FOMO.
That said, if Bitcoin price experiences massive buying pressure that pushes it to produce a weekly candlestick close above $52,000, it will create a higher high and invalidate the bearish thesis.
Such a development could see sidelined buyers step in to propel Bitcoin price to $60,000 or higher.
Author

Akash Girimath
FXStreet
Akash Girimath is a Mechanical Engineer interested in the chaos of the financial markets. Trying to make sense of this convoluted yet fascinating space, he switched his engineering job to become a crypto reporter and analyst.



![Zcash breaks above 2018 highs, eyes 1600–2500 [Video]](https://editorial.fxsstatic.com/images/i/crypto-coins-1.png)