Bitcoin Weekly Forecast: Exploring 2022, the year of BTC fractals
- Bitcoin price is moving in lockstep above a stable support level at $21,209.
- A spike in selling pressure could lead to a sweep of the sell-stop liquidity resting below the $20,750 level or a steep correction to $20,000
- A daily candlestick close above the $25,000 psychological level will invalidate the bearish outlook.

Bitcoin price shows a tight consolidation on a lower time frame – an ascending parallel channel – that repeats the motif of three larger channels that have developed on higher time frames since the start of 2022.
A breakdown of the latest channel could result in a correction to the $20,750 or $20,000 support levels before a recovery rally kick starts.
Bitcoin price in a bit of a pickle
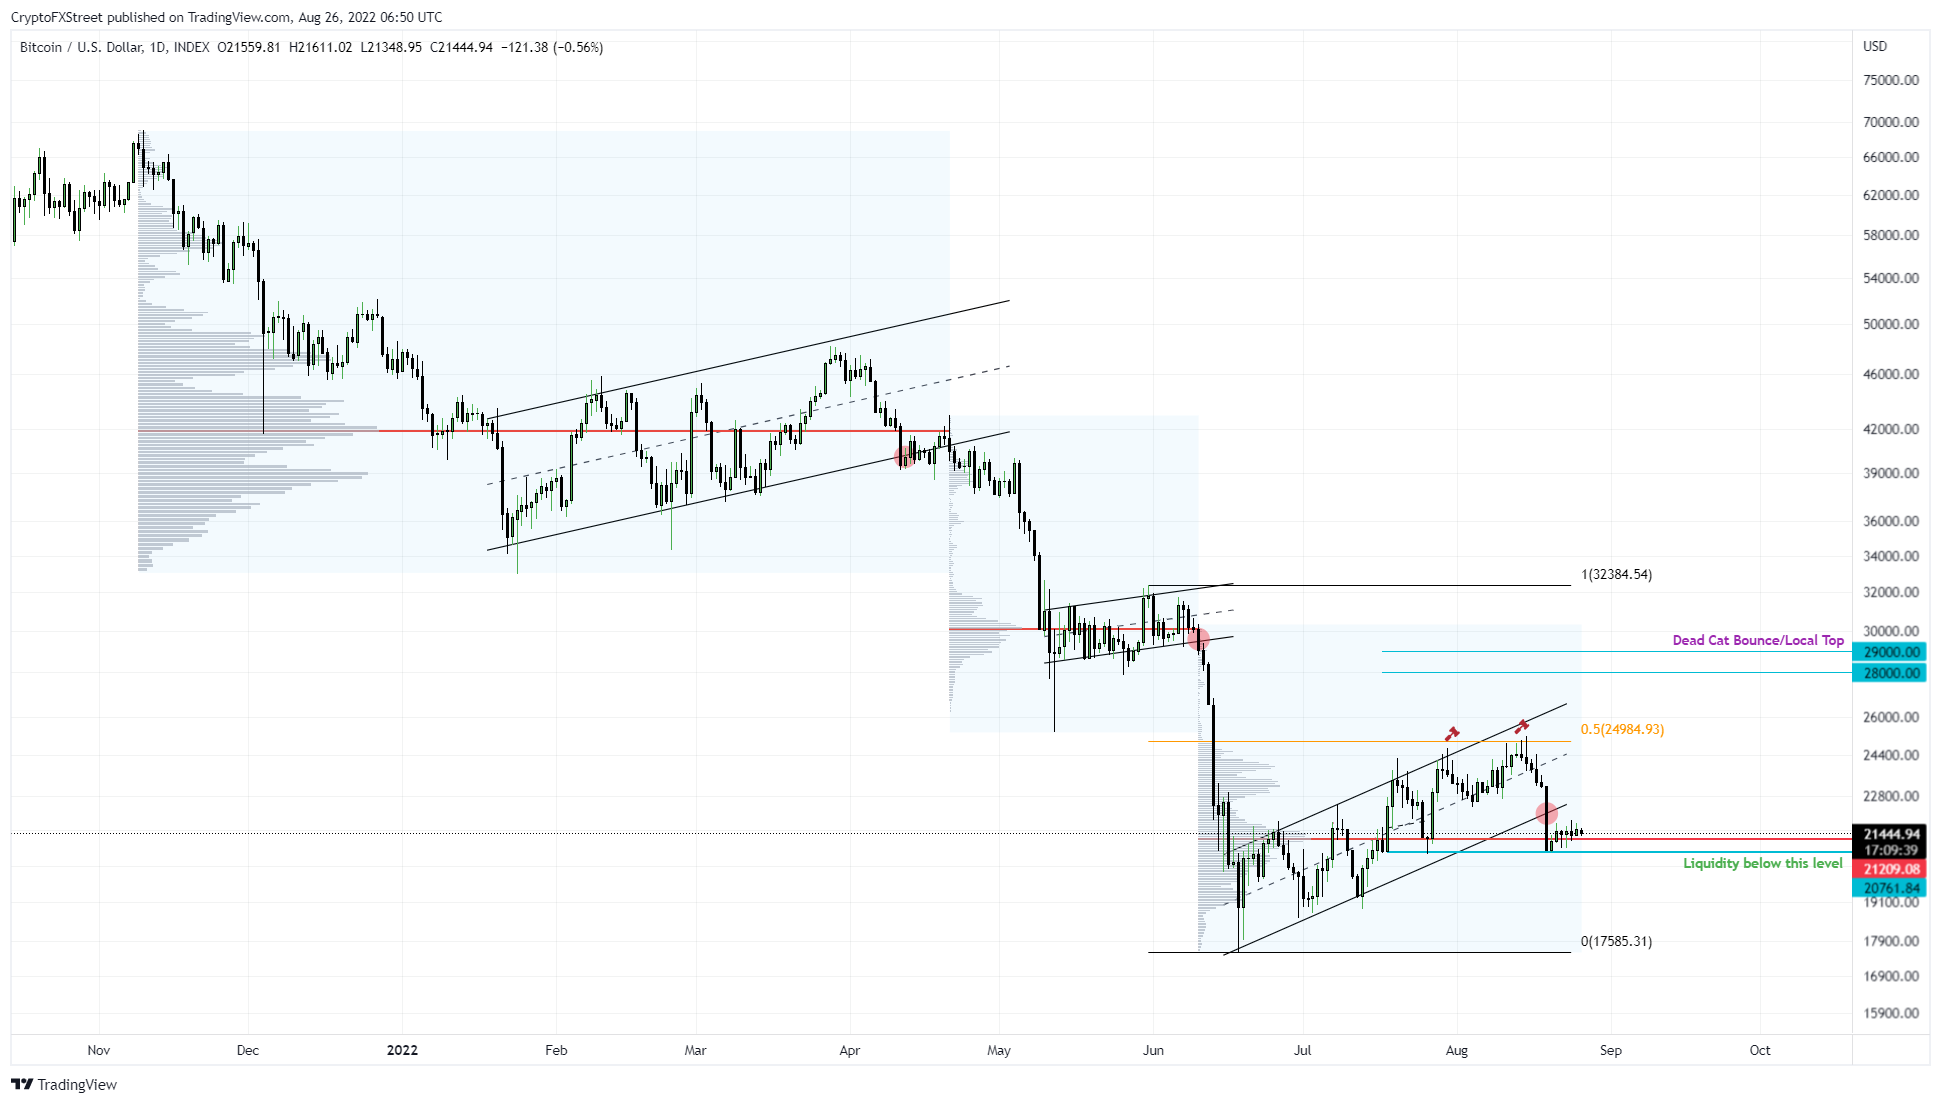
Bitcoin price clearly shows three ascending parallel channels that have developed over the last eight months, all of which have led to bearish breakdowns. The most recent one was on August 19, when BTC crashed 10% from roughly $23,200 to $20,800.
As a result, Bitcoin price has now created roughly three equal lows around $20,750. Despite this drop, BTC managed to recover above the highest volume traded level, aka Point of Control (POC), at $21,209, a positive achievement.
Regardless, the liquidity resting below these swing points at roughly $20,750 is the main objective of market makers, which is why they will most likely push BTC price down to sweep this level again before attempting a recovery rally.
Before jumping to a conclusions, however, let’s take a look at a chart on a lower time frame.
BTC/USDT 1-day chart
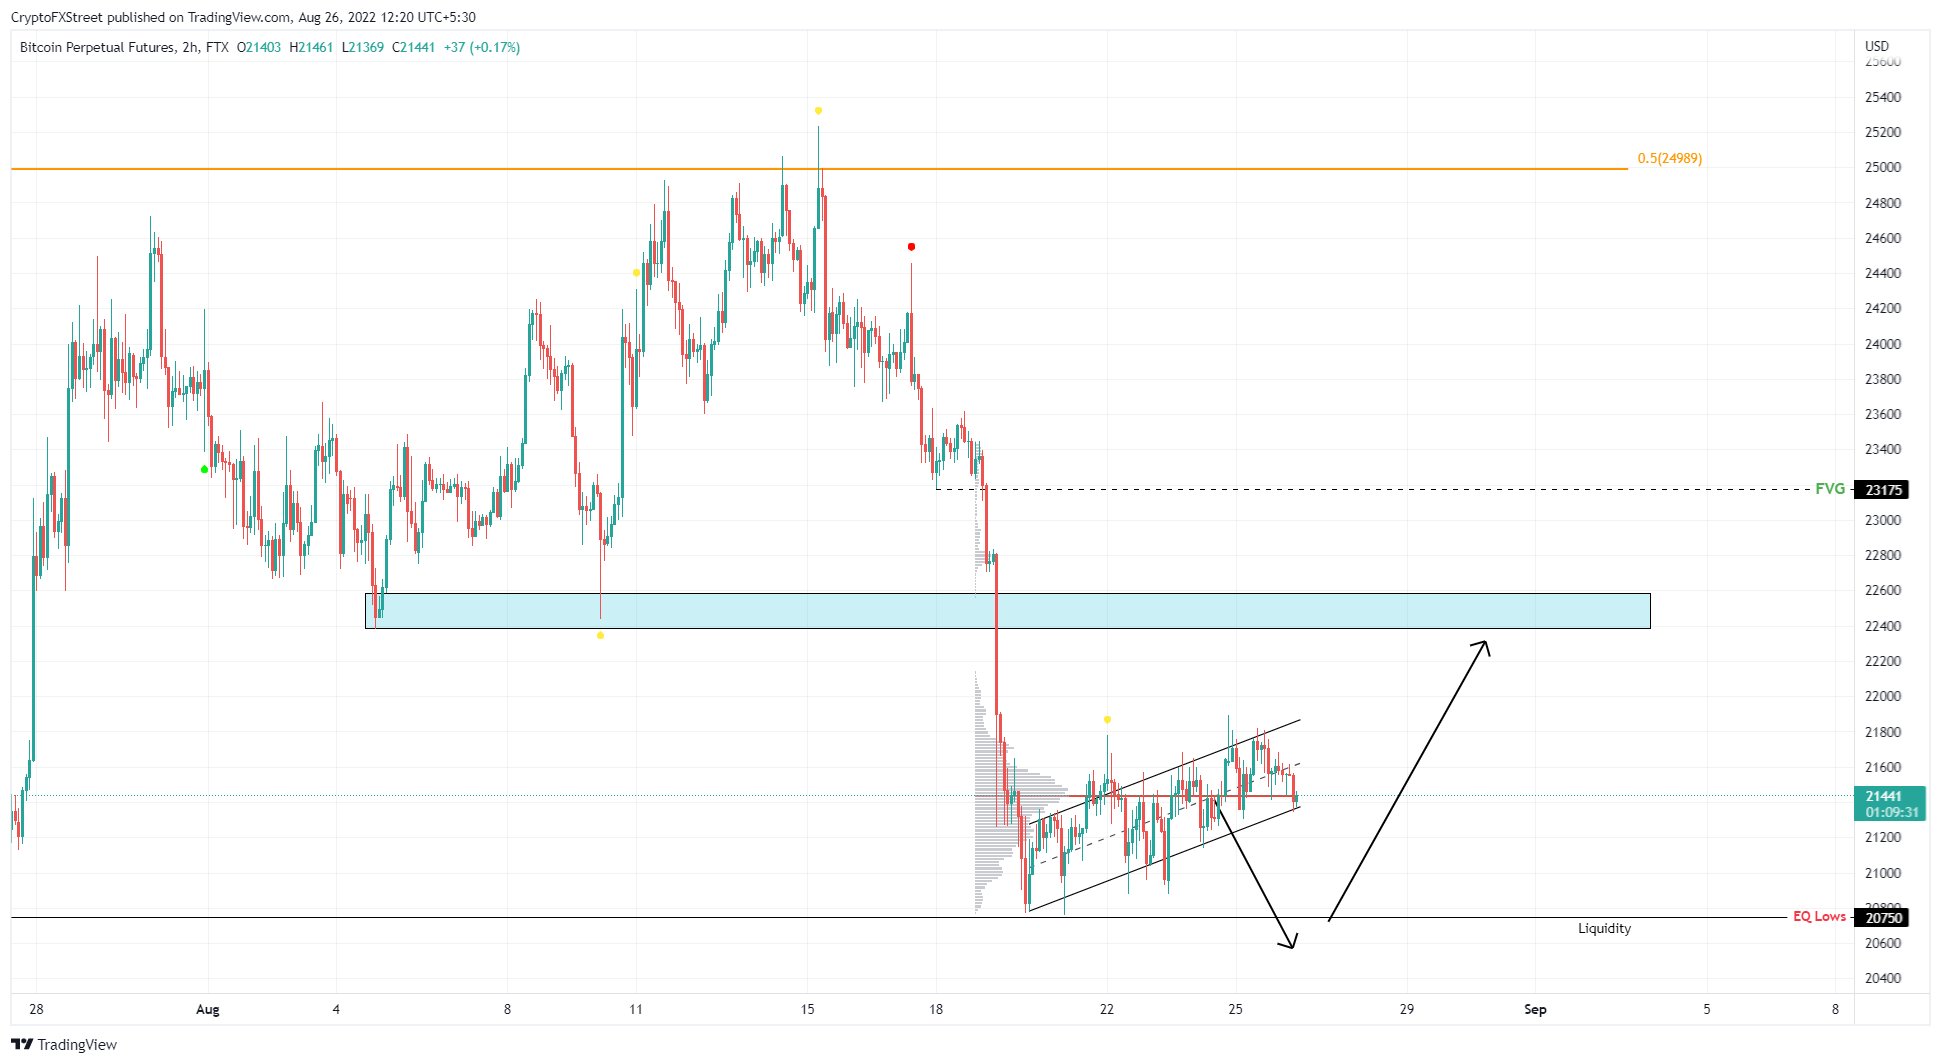
On the one-hour chart, Bitcoin price seems to be forming another ascending parallel channel – a fractal ‘echo’ of the larger time frame channels – and this too is extremely close to breaking down. However, the highest volume traded between August 18 and August 22 is at roughly $21,437. This level, also called the Point of Control (POC), will serve as a support level, and a flip of this foothold into a resistance barrier will confirm a lower time frame breakdown.
Nonetheless, market participants also need to be aware of the higher time frame POC at $21,209, which could simultaneously thwart bears’ plans. Therefore, waiting for secondary confirmation, provided by a breakdown of the $21,209, will add more credence to the idea of a selling spree to $20,750
BTC/USDT 1-hour chart
While the forecast for a downswing to collect liquidity makes sense, it might never happen if Bitcoin price fails to break below the $21,209 support floor. Instead, a bounce off this barrier could prematurely trigger a recovery rally.
In such a case, market participants can expect Bitcoin price to encounter the $22,382 to $22,586 blockade. Clearing this hurdle will be relatively easy to overcome, which will push BTC to fill the imbalance at $23,175 and potentially form a local top.
Outlining the potential for a bullish outlook
If the recovery rally thesis explained above continues to build momentum, it could propel the Bitcoin price to retest the $24,989 hurdle, which is the midpoint of the 44% crash BTC witnessed between May 31 and June 18.
This level has been a particularly hard one to overcome in the past, as BTC failed after three attempts in August. Hence, a decisive daily candlestick close that flips this barrier into a support floor will be a strong indication of the presence of bulls and a resurgence of buyers.
Such a development will also invalidate the bearish thesis and open the path for recovery up to $29,000.
As seen in the one-day chart, the area between $28,000 to $29,000 is likely where the relief rally will face massive selling pressure from holders booking profits; hence a local top could form here.
Author

Akash Girimath
FXStreet
Akash Girimath is a Mechanical Engineer interested in the chaos of the financial markets. Trying to make sense of this convoluted yet fascinating space, he switched his engineering job to become a crypto reporter and analyst.


