Bitcoin Weekly Forecast: Crypto markets to experience one last sell-off
- Bitcoin price continues to consolidate around the $19,000 to $20,000 levels for the second week.
- Market participants should be prepared for a sweep of $17,593 if the $18,800 support level fails to hold.
- A breakdown of the $15,551 support level will signal an invalidation of the bullish outlook.

Bitcoin price has been in a steady consolidation for more than two weeks and shows no signs of directional bias. However, the Non-Farm Payrolls (NFP) announcement on October 7 could trigger a volatile episode for BTC that could resolve its range tightening and establish a directional bias.
Bitcoin price and the big picture
Bitcoin price remains above $19,157, which is the highest traded volume level for 2022, aka Point of Control (POC). As mentioned in the previous article, buyers are safe as long as BTC remains above the POC; however, a breakdown could result in a steep correction to the next high-volume node at $15,551.
Beyond this support floor, there are two crucial levels at $13,575 and $11,989, where a macro bottom could occur for BTC. Not a lot has changed on this three-day chart for Bitcoin, but investors need to keep a close eye on the POC at $19,157 and the immediate support level at $15,551.
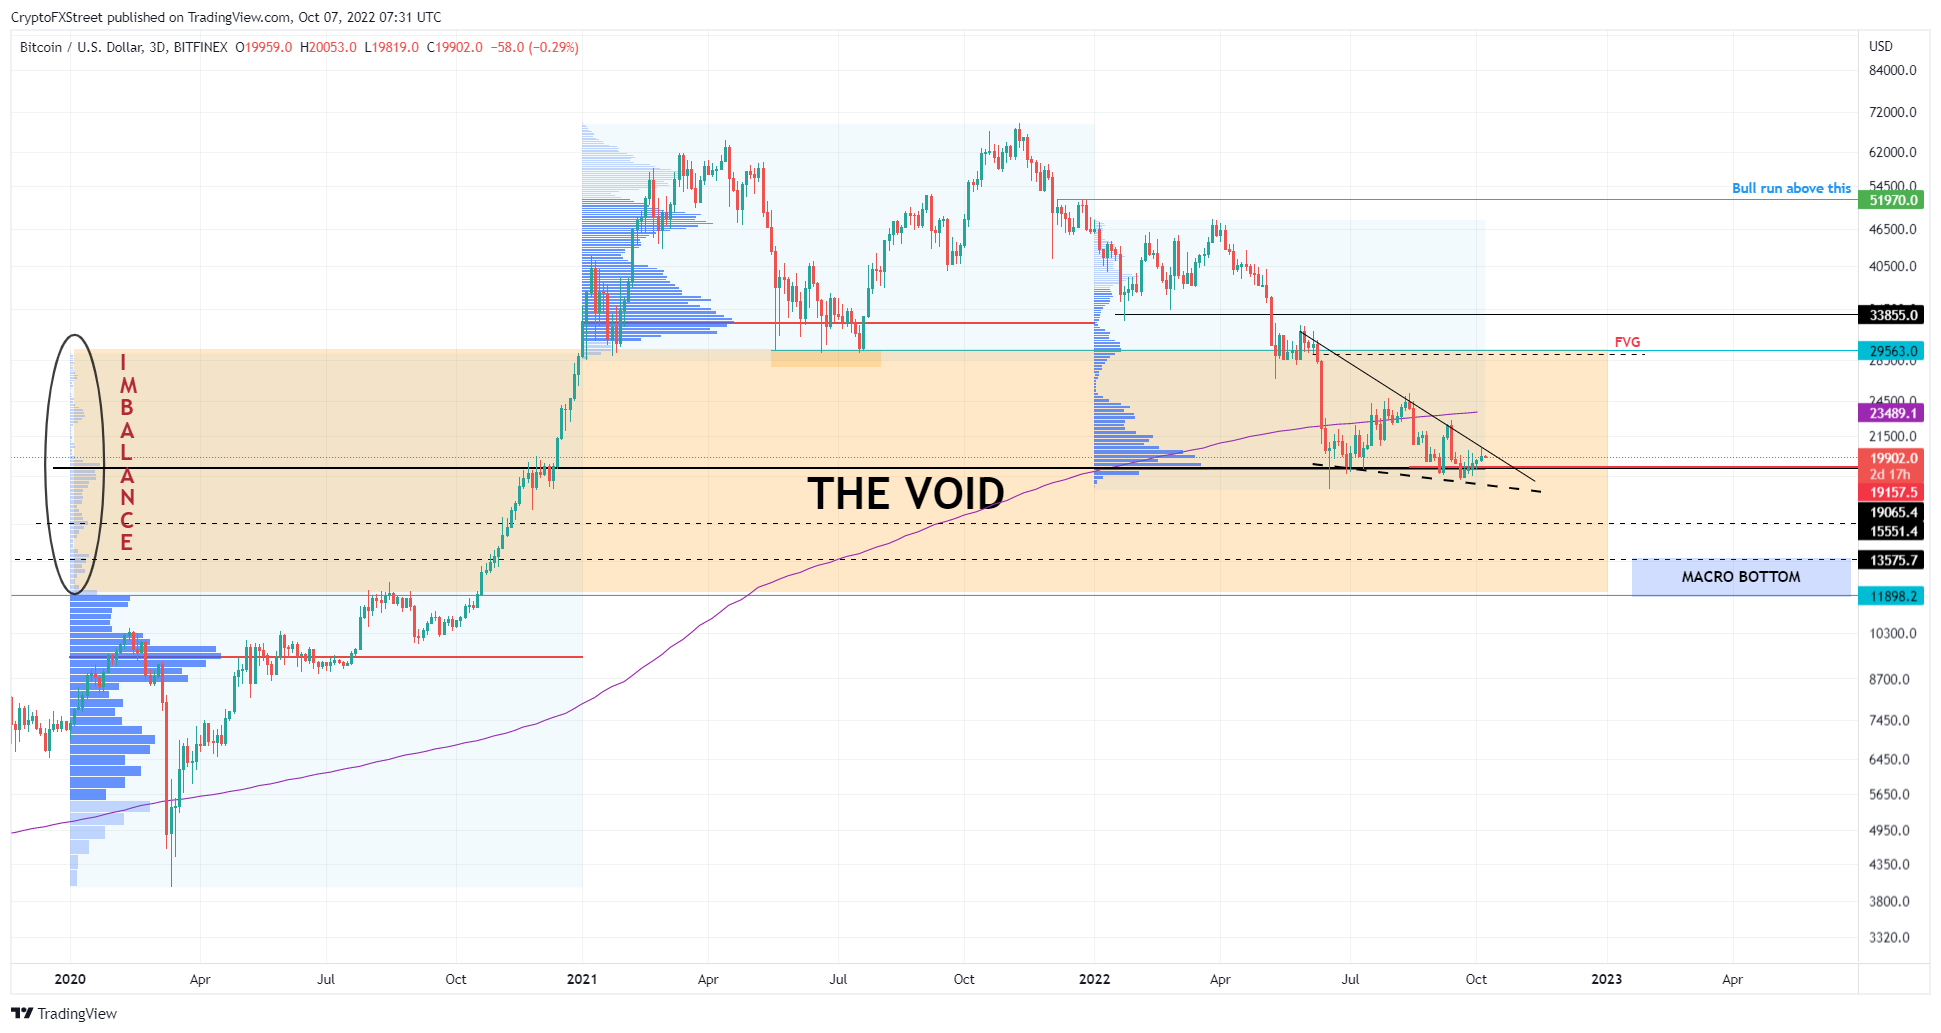
BTCUSDT 3-day chart
The next important chart is the eight-hour chart of Bitcoin price coupled with the Relative Strength Index (RSI), which has accurately predicted the local top/bottom formation since May 30.
After a brief consolidation between the $18,000 and $19,000 levels, Bitcoin price shot up to $20,400, and the RSI also broke above the 43 to 46 hurdle and flipped it into a support level. The rally that originated here formed a local top at $20,500, which coincided with RSI forming the seventh top at the 65 to 72 hurdle.
A closer look at the Bitcoin price shows a bear flag in play. As the name indicates, this technical formation contains a flagpole, which was formed as BTC crashed 18% between September 12 and 19. The consolidation in the form of an ascending parallel channel resulted in the flag formation.
A breakdown of this technical pattern forecasts an 18% downswing to $15,800, obtained by adding the flagpole’s height to the breakout point at $19,417.
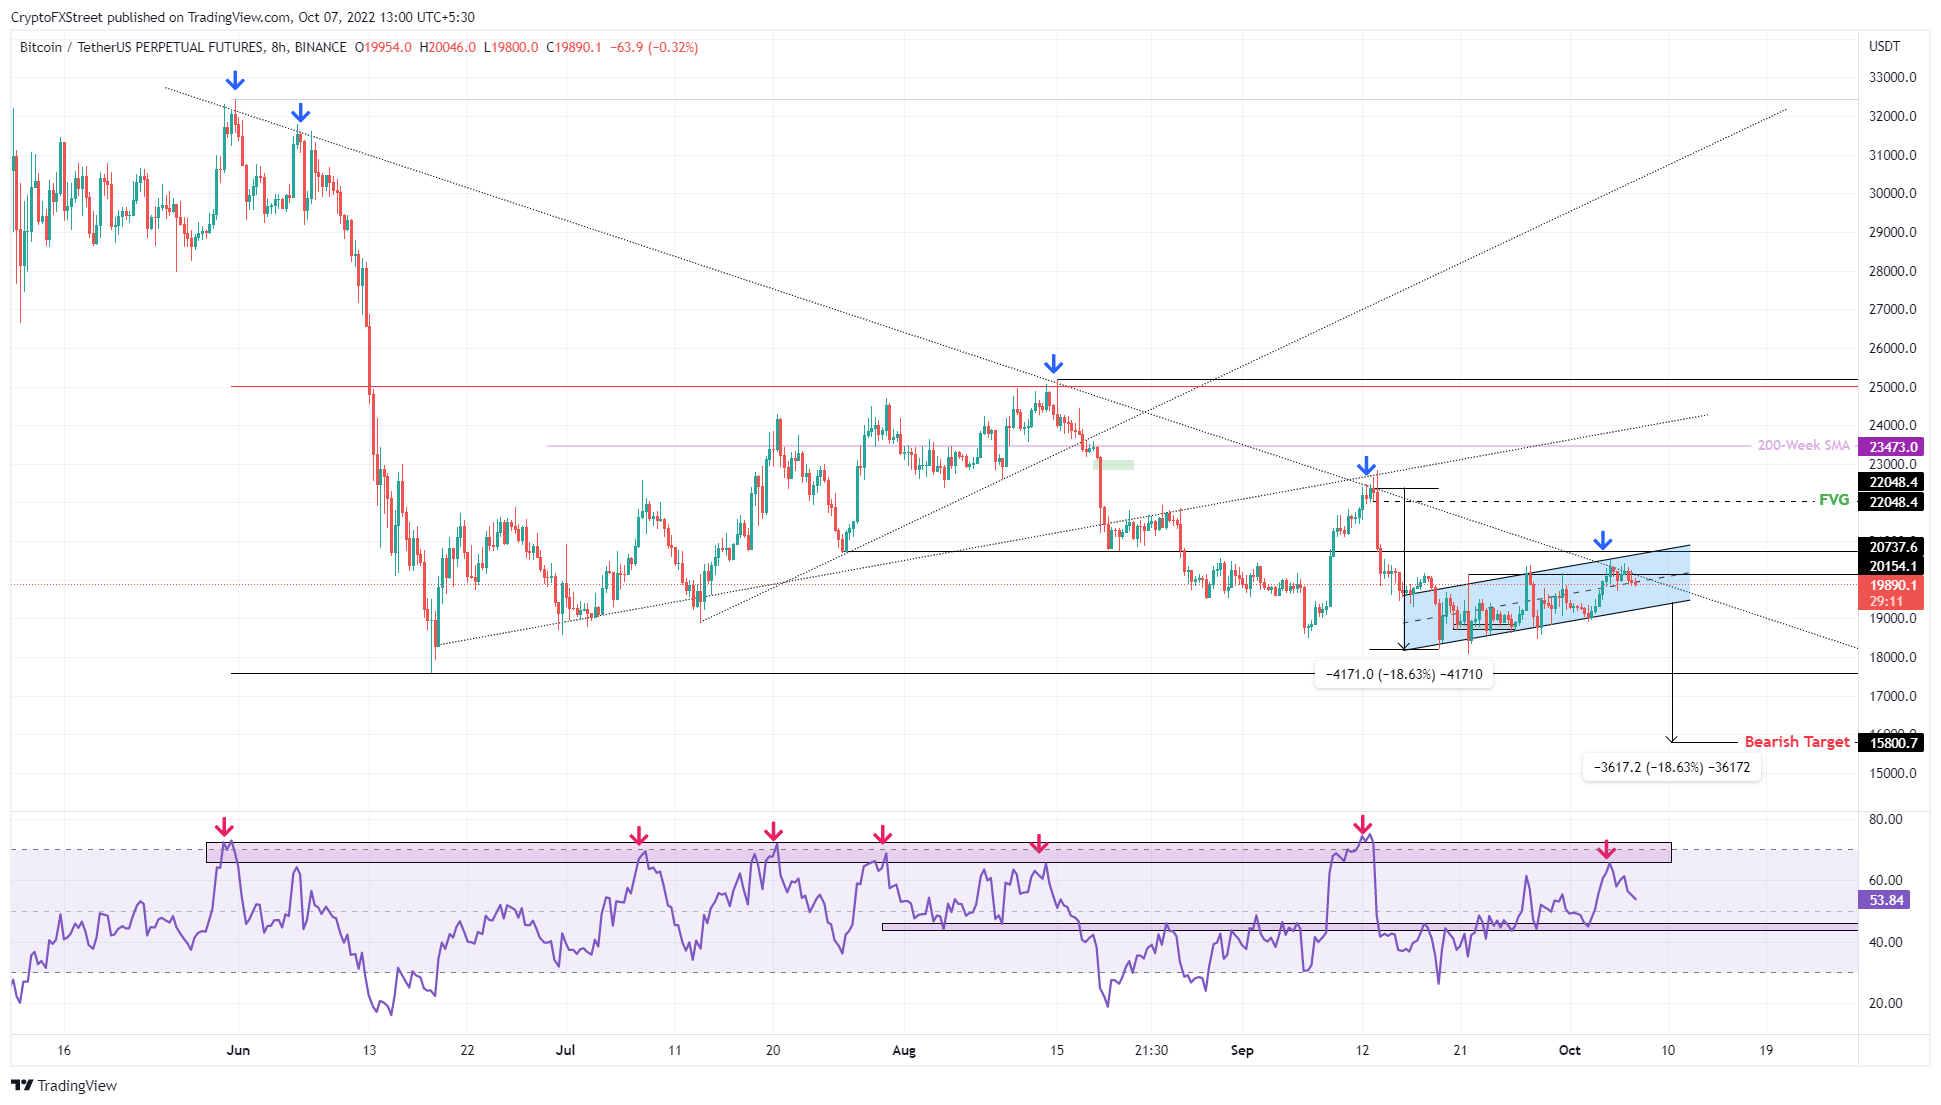
BTCUSDT 8-hour chart
Additionally, the realized price of whales holding more than 1,000 BTC is around $15,800. The realized price of these BTC is calculated by taking into account the volumes flowing in and out of exchanges and the Bitcoin price at that time.
Interestingly, this number coincides perfectly with the technical forecasts, adding more credence to the possibility of a steep correction to $15,800.
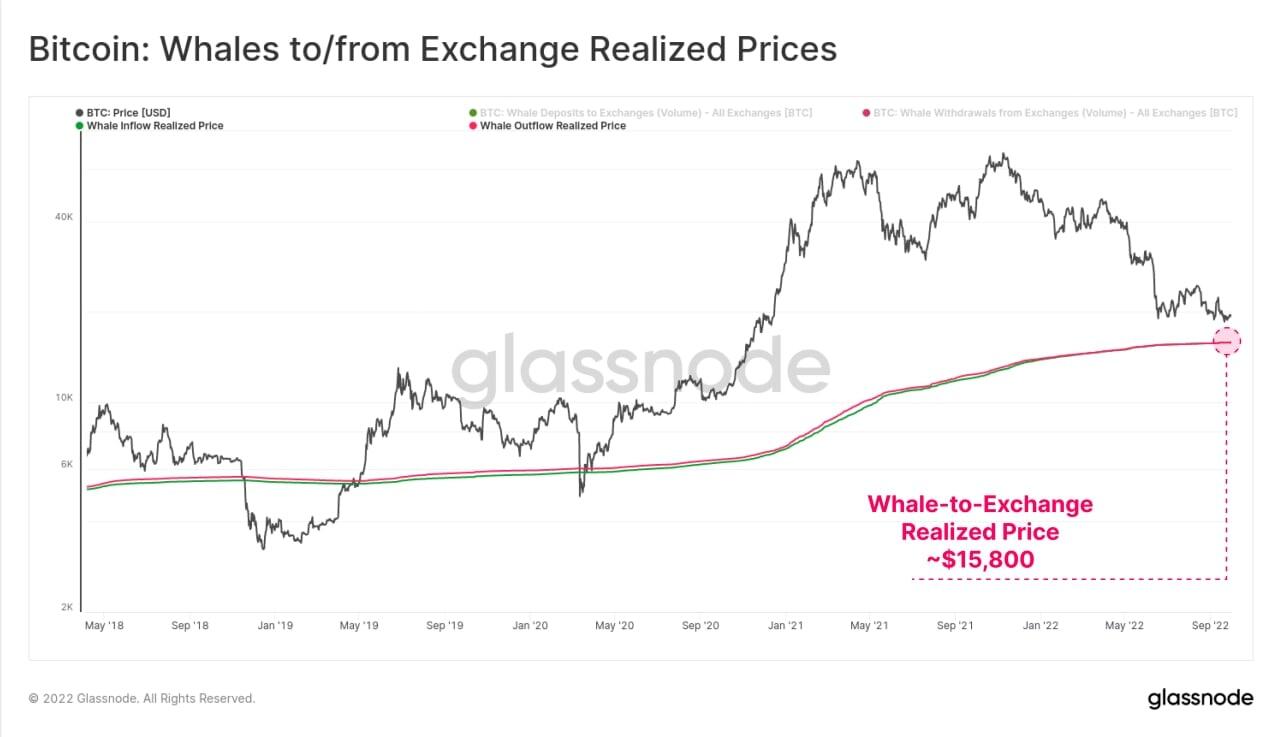
BTC Realized Price
While the initial outlook for Bitcoin price might seem bearish from the above explanation, investors should look at this potential crash to $15,800 as an opportunity to accumulate BTC and altcoins at a discount.
A surge in buying pressure at this level that results in a U-turn could be the best buying opportunity before Bitcoin price kick-starts a run-up to fill the CME gap, extending from $27,365 to $28,740.
These gaps are formed in Bitcoin price as the Chicago Mercantile Exchange (CME) halts trading at the weekend. Therefore, a rebalance of these inefficiencies could be another key driver that triggers a reversal at $15,800.
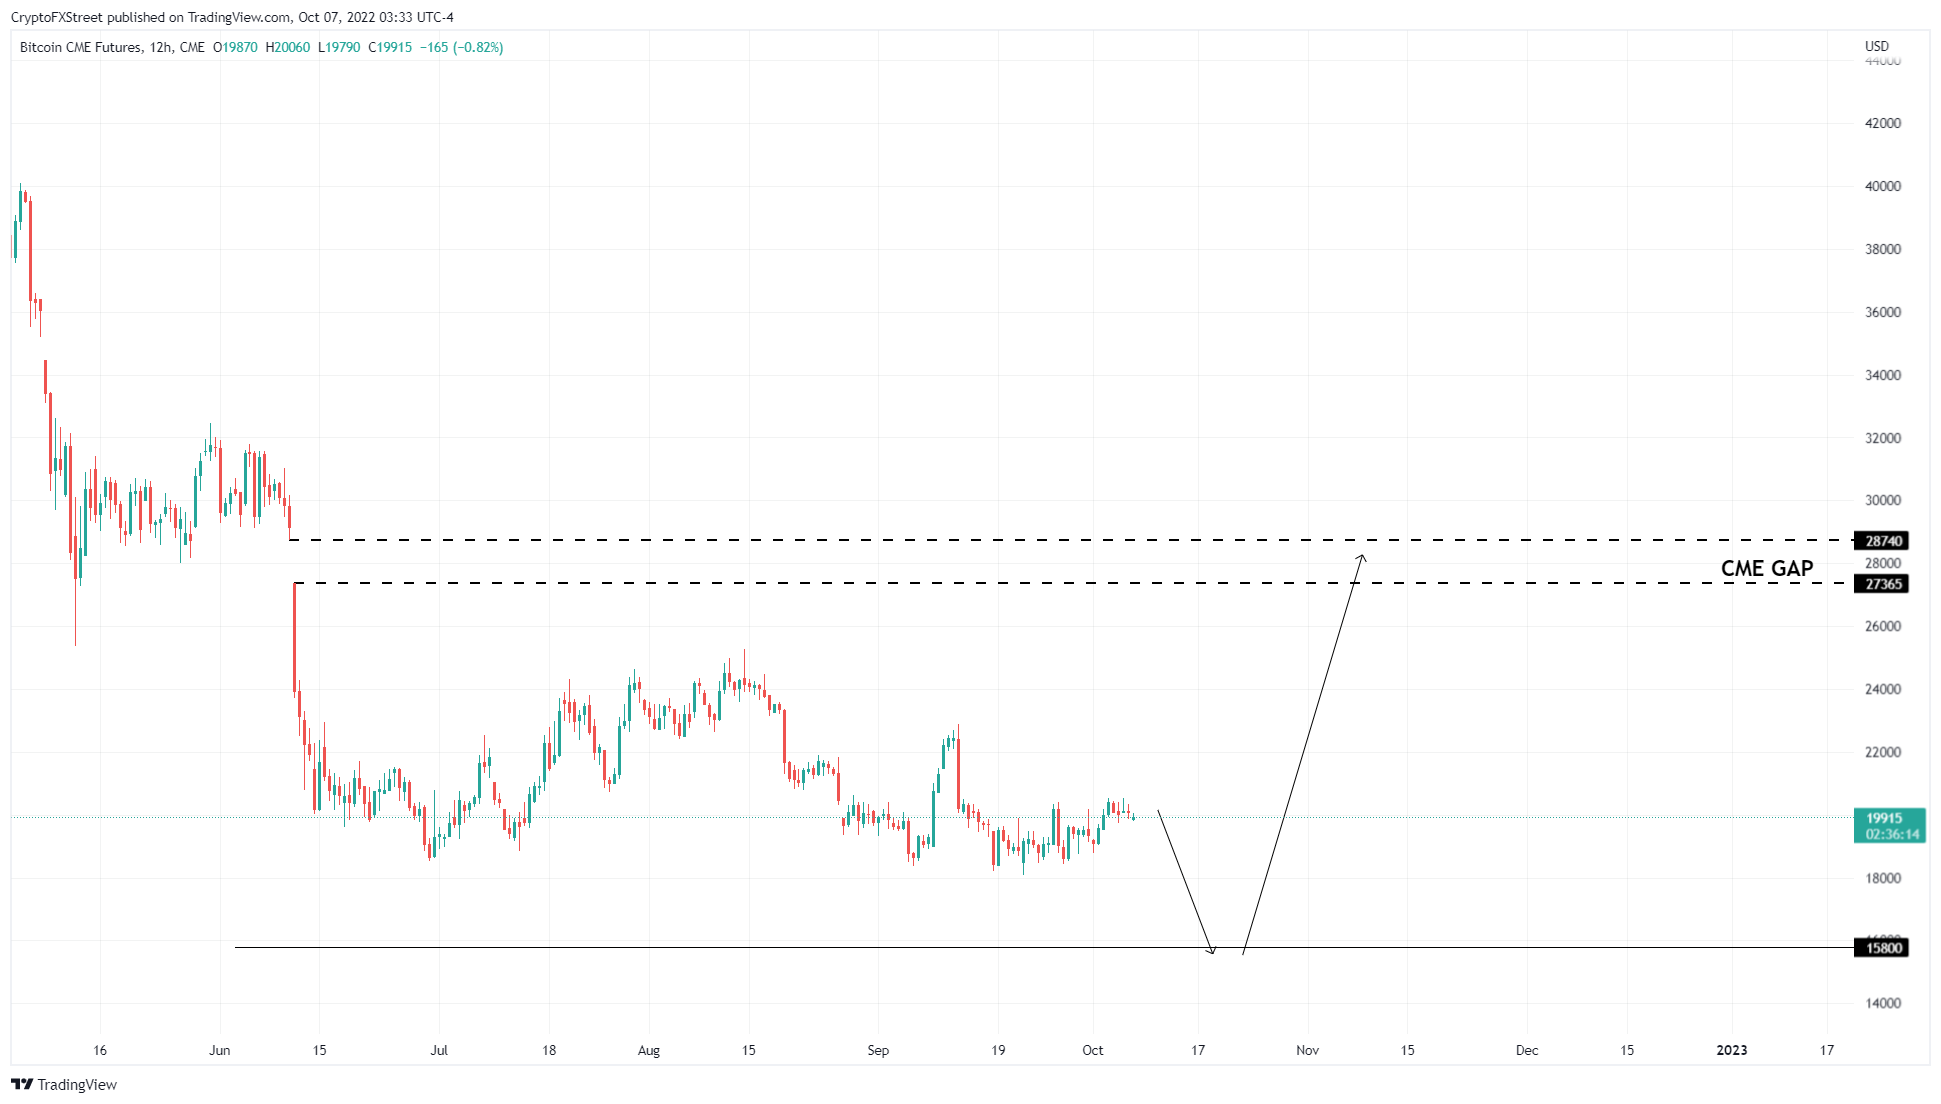
BTCUSD CME 12-hour chart
On the other hand, if the selling pressure continues to build up on the back of rising geopolitical tensions and worsening economic conditions, Bitcoin price could crash to $15,800 and fail to recover. If this downswing pushes BTC to flip the $15,551 support level into a resistance barrier, it will invalidate the bullish thesis detailed above.
In such a case, market participants should prepare for a potential crash to $13,575 and $11,989.
Author

Akash Girimath
FXStreet
Akash Girimath is a Mechanical Engineer interested in the chaos of the financial markets. Trying to make sense of this convoluted yet fascinating space, he switched his engineering job to become a crypto reporter and analyst.



