Bitcoin Weekly Forecast: BTC/USD drops its safe-haven status
- Bitcoin experienced a sharp sell-off amid massive risk-aversion on the global markets.
- High volatikity is typical for the cryptocurrency markets.
- BTC/USD stays within a triangle pattern with risks skewed to the downside.

Bitcoin finally broke free from a tight range that dominated for the most part of the week, but the direction of the breakthrough was somewhat disappointing. After feeble attempts to clear $10,000, BTC/USD made a sharp U-turn and crashed to $9,000. The coin lost $1,000 or 7% of its value in a matter of hours. Once the carnage was over, BTC/USD managed to recover to trade at $9,450 by press time.
Volatility is a frequent guest
Such volatility is nothing new to the industry. Sharp price moves are frequent guests on the cryptocurrency market, notorious for its unpredictability and herd behavior. A similar situation was observed in early May. Then BTC/USD also came close to the cherished resistance of $10,000 and seemed to be preparing to break out into a new territory. However, instead of mooning, it reversed and reached $8,700 in just three days.
History repeated itself on May 15. At that time, bitcoin traded around $9,700 and in a matter of minutes got $400 cheaper. And last week Bitcoin price jumped above $10,000 in a few minutes, only to return to the old range on the next day.
Factors behind the sell-off
Thursday's price movement coincided with a number of fundamental and technical events.
A collapse in the stock market. The American stock markets went through one of the worst declines since Black Thursday. The Dow Jones lost 5.7% at the opening, while the S&P 500 decreased by 4.8% as the World Health Organization (WHO) warned about the risks of the second wave of COVID-16. Oil prices also crushed down amid concerns over global demand. Even gold prices went down. Bitcoin and other cryptocurrencies moved in unison with other asset classes.
The digital coins are often considered as a save-haven. However, if the market is gripped by fear, they tend to move down in sync with the rest assets. According to a prominent market analyst Mati Greenspan, this is a typical situation.
In an economic contraction, the value of all assets declines simultaneously. Just as it all grows together during an expansion, he wrote on Twitter.
Hackers and whales on the move. The coins that were stolen in 2016 moved again. The hackers transferred BTC worth about $4 million to several unknown wallets. Such activity always alerts market participants, as hackers may start dumping the coins to cash out their loot. Meanwhile, large-scale sales will inevitably lead to a price decrease.
Apart from that, a cryptocurrency service Whale Alert spotted several large transfers from unknown wallets to the cryptocurrency exchanges. Thus, someone transferred over 5,000 BTC to Binance and 16,000,000 USDT to Bitfinex, which is also an alarming signal of the potential massive sell-off.
Liquidations at BitMEX. BitMEX is a usual suspect as the cascading liquidation of leveraged positions often increase the pressure in the market and may turn a natural correction into a complete disaster. According to the analytical service Skew, long positions worth $55 million were liquidated on the platform during the sell-off.
BTC/USD: Technical picture
On a daily chart, Bitcoin (BTC) moved back inside the triangle pattern, and now the recovery is limited by its upper boundary at $9,550. BTC/USD touched this area on Friday, but reversed back below $9,500, which means that the price may stay in the narrowing range for some tome before the decisive break through takes place. The lower boundary of the broken triangle comes at $9,200, and currently it is reinforced by daily SMA50. This area serves as a vital local support for the coin. If it is sustainably broken, the sell-off may quickly gain traction with the next focus on $9,000 (weekly low) and $8,780, which is reinforced by the weekly SMA50.
Considering the downward-looking RSI on a weekly chart, the bearish scenario looks highly likely in the long-run. However, BTC bears might have to wait before the price goes below $9,000 to celebrate a victory. Otherwise, BTC/USD stays within a consolidation pattern.
BTC/USD daily chart
-637275740214653702.png)
According to Intotheblock data, 74% of Bitcoin users are in the money now with 1.43 million BTC addresses have their break even price in the range from $9,470 to $9,670. It means that the bulls may have hard time making their way through this area.
On the upside, the local resistance created by the above-said upper boundary of the triangle $9,550. Once it is out of the way, the upside is likely to gain traction with the next focus on the psychological $10,000 followed by the highest level of the previous week at $10,414 and the highest level of $10,511.
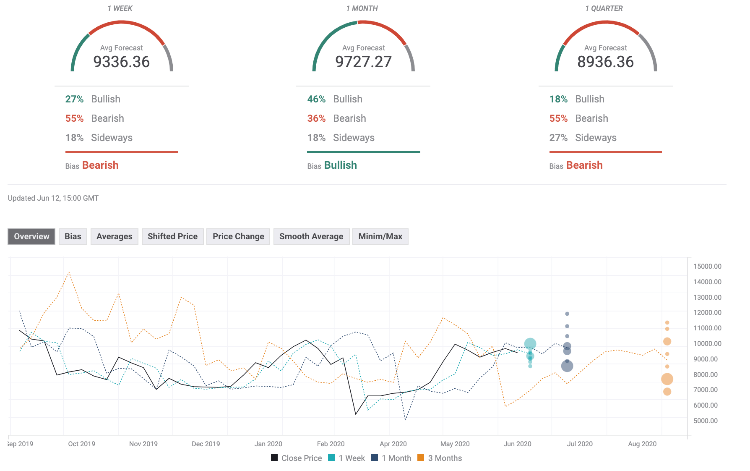
The Forecast Poll reflects a worsened picture as the market expectations on all time intervals decreased significantly. The weekly and quarterly expectations are bearish, while only monthly forecast is bullish. Also, the forecasted price is below $10,000 on all time frames. Moreover, the expected quarterly dropped below $9,000 It means that the market participants do not believe in a sustainable recovery in the foreseeable future.
Author

Tanya Abrosimova
Independent Analyst


