Bitcoin Weekly Forecast: BTC unchanged, but bullish recovery is still on the cards
- Bitcoin price is likely to provide an opportunity to accumulate BTC.
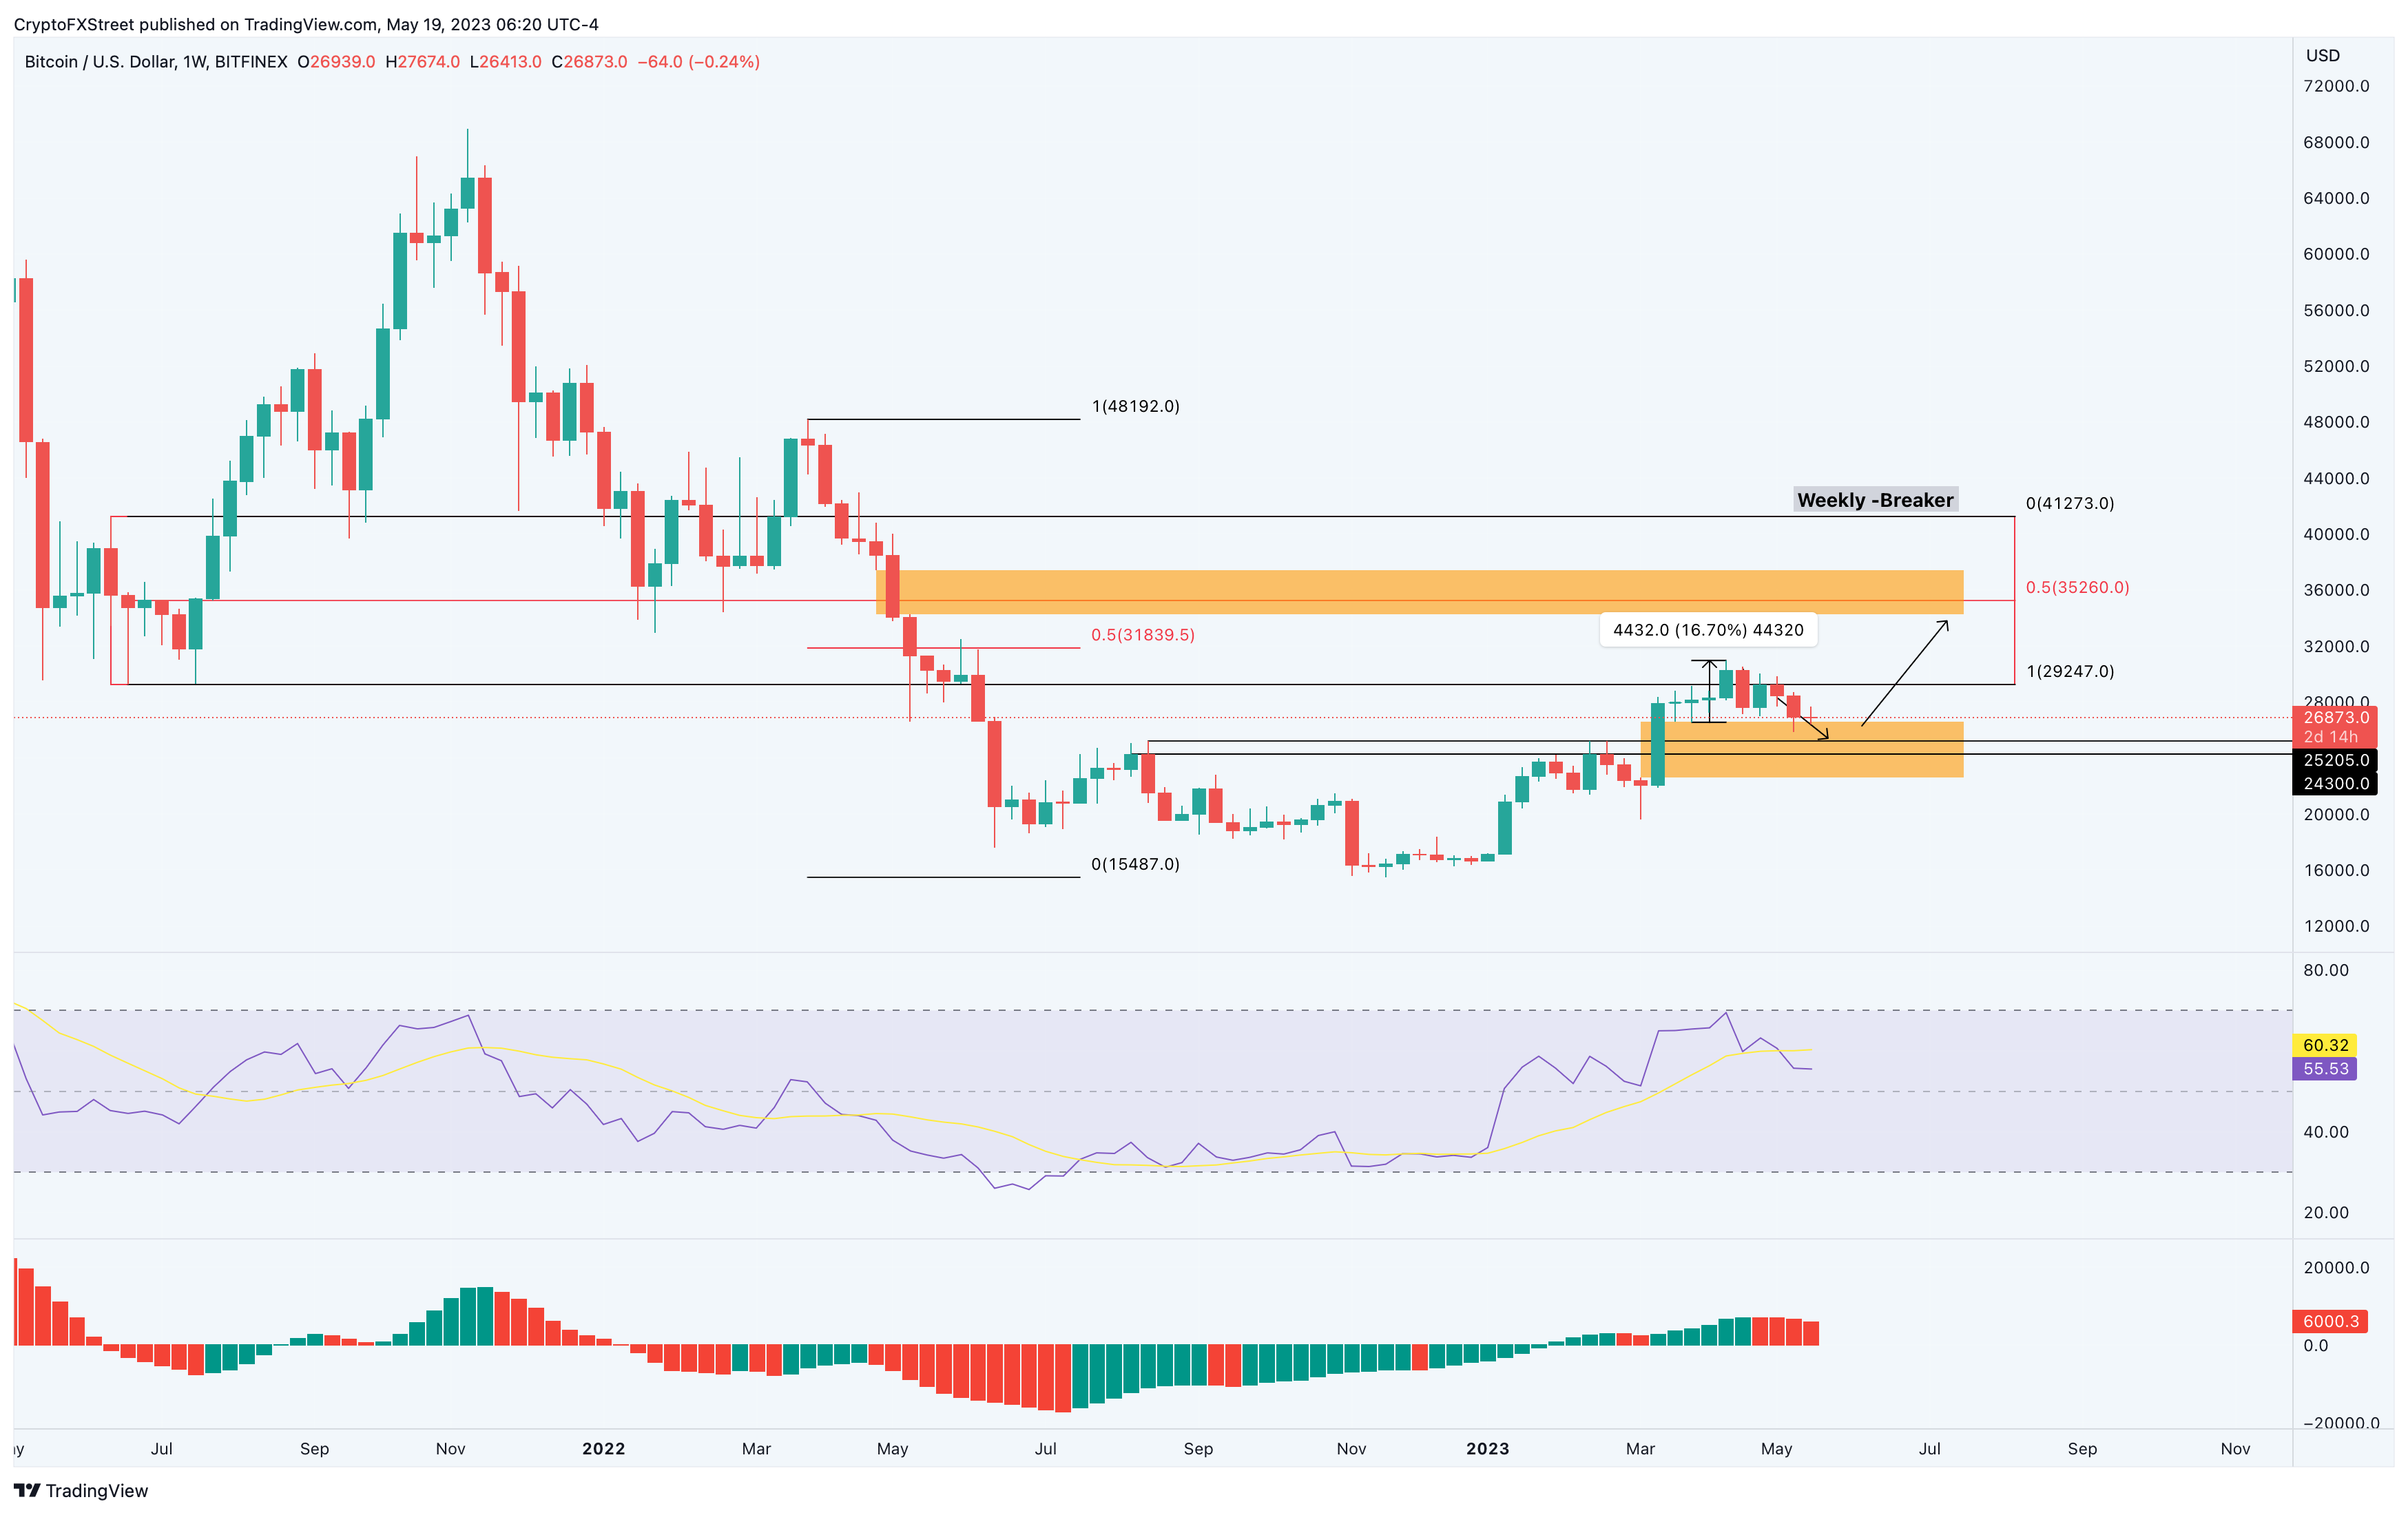
- A bullish recovery outlook could see BTC tag $35,260 or even $41,273.
- Invalidation of the bullish thesis for BTC will occur if the big crypto flips the $22,591 support barrier into resistance.

Bitcoin price outlook on the weekly chart has not changed much. BTC is still trying to find a stable support level for a recovery rally, but things could get worse if sellers overwhelm the next accumulation zone.
Also read: Bitcoin and Ethereum struggle with declining price volatility as options traders turn bearish
Bitcoin price remains stable
Bitcoin price has yielded nearly a 90% gain for holders in the 2023 rally, but it continues to retain its bullish outlook. On the weekly chart, BTC is stuck between a Bearish Breaker, extending from $29,247 to $41,273, and the Fair Value Gap (FVG), stretching from $22,591 to $26,591. Interestingly, the FVG has two stable support levels at $24,300 and $25,205, which will serve as an accumulation zone for sidelined buyers.
There is a high likelihood that Bitcoin price will bounce off the aforementioned FVG, but investors need to wait for confirmation on the lower time frames like the daily or the four-hour charts. The resulting bounce will create a lower low and potentially kickstart an upswing that tags the midpoint of the weekly Bearish Breaker at $35,260.
Although unlikely, a sustained bullish momentum or a spike could extend this uptrend and push Bitcoin price to tag the breaker’s upper limit at $41,273.
Moreover, the Relative Strength Index (RSI) and the Awesome Oscillator are above their respective mean levels, suggesting that the bullish momentum has deteriorated. While this is not good news for bulls anticipating a rally, it does not serve bears either as they patiently wait for further crashes.
BTC/USDT 1-week chart
The detailed outlook explained above is speculation based on significant Bitcoin price levels alone, but on-chain metrics add nuance to understanding investors' sentiment. The 30-day Market Value to Realized Value (MVRV) model shows that BTC has not bottomed yet.
This indicator is used to identify the average profit/loss of investors who purchased BTC over the past year. Based on Santiment’s research, a value below -10% indicates that short-term holders are at a loss and are likely to sell. More often than not, this is where long-term holders accumulate. Hence, any move below -10% is termed an “opportunity zone.”
From the chart below, Bitcoin price has triggered a reversal when the 30-day MVRV has tagged the -10% to -18% levels. The MVRV currently hovers around -4.12%, however, indicating that more corrective waves are likely to manifest soon.
 [16.09.21, 19 May, 2023]-638200926840936626.png)
BTC 30-day MVRV
Moreover, the decline in Active Addresses after April 2023 is significant, and this metric has slid from 306 billion to 160 billion, showing that there are not as many active users. This indicator should be taken with a grain of salt as the blockchain technology matures and new uses or use cases are born, which could trim the active addresses figure while investors accumulate. Hence, this metric is not a perfect one, but it does indicate that speculation using the Bitcoin network has come down significantly.
 [16.15.35, 19 May, 2023]-638200927018786654.png)
BTC Active Addresses
As a result, if Bitcoin price slips lower and flips the $22,591 support barrier into a resistance level, that would invalidate the bullish thesis. In such a case, BTC is likely to revisit the November 7 swing low at $15,487.
Author

Akash Girimath
FXStreet
Akash Girimath is a Mechanical Engineer interested in the chaos of the financial markets. Trying to make sense of this convoluted yet fascinating space, he switched his engineering job to become a crypto reporter and analyst.


