Bitcoin Weekly Forecast: $35,000 or $23,000, which CME gap gets filled first?
- Bitcoin price and its recent uptick in bullish momentum suggest that the $34,445 to $35,180 CME gap will be filled first.
- However, the existence of a bear flag pattern indicates that a breakdown of weekly support at $28,850, could trigger a 37% crash.
- One significant on-chain metric forecasts that a sell-off is brewing for BTC, $17,975 may be in view.

Bitcoin price has been consolidating since the May 12 crash and has stayed relatively flat from a macro standpoint. As a result of this consolidation, BTC could be preparing for a volatile move that will shock investors.
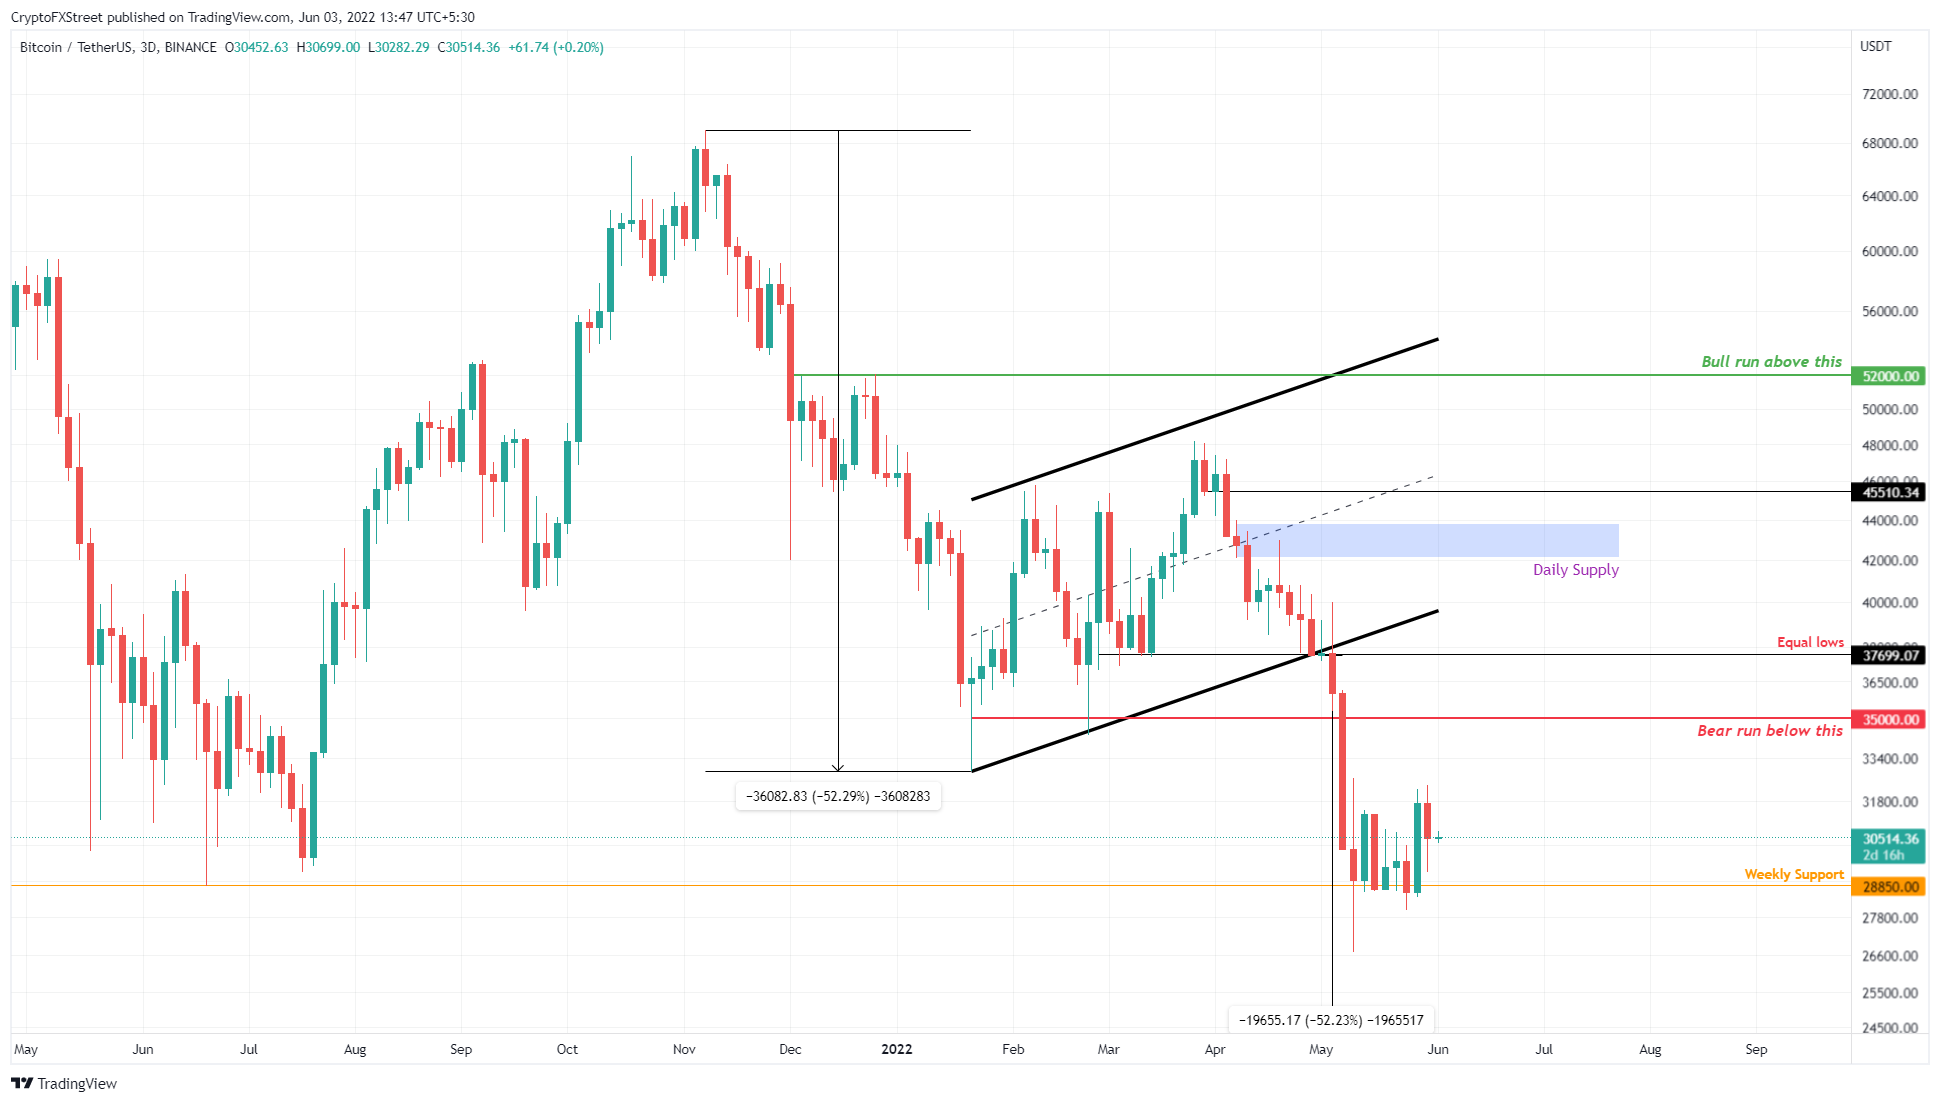
Bitcoin price and its directional bias dilemma
Bitcoin price breached the bottom of a bear flag pattern on May 1, signaling more downside to come. Although it was obvious in hindsight, the crash from $37,699 to $26,700 caught many investors off guard.
The bear flag pattern, as seen in the chart, actually forecasts further downside that is yet to come, with a 52% crash to $17,975 as the final price objective. So far, BTC has come to the halfway point of this theoretical target and is currently consolidating above a weekly support level at $28,850.
Furthermore, BTC has managed to bounce off this support zone by 13% and set up a swing high at $32,399. While impressive, the macro outlook remains bearish regardless of many expecting a relief rally.
Investors are split into two camps, one that believes a relief rally is in play to $35,000 or $36,000; the other that the crash will continue and that the recent uptick is just a deviation from the ongoing consolidation.
For the bearish outlook to take place, the breakdown of the $28,850 support level is not just crucial but is also a key requirement. If such development comes before a relief rally, there is a high chance Bitcoin price will reach its forecast target at $17,975, which is just below the 2017 all-time high of $19,798.
BTC/USDT 1-day chart
This outlook would cause maximum collateral
While the above bearish outlook is logical it does not factor in the smart money or the market makers’ point of view. Markets tend to act in a contrarian fashion, with the most brutal crashes often occurring when the majority of the retail camp is bullish and expecting a bull rally and vice versa when bearish. This is because retail investors are usually wrong and trading in the opposite direction to smart investors. This gives further credence to the possibility a recovery may occur despite the bearish indications covered above.
Reasons why a relief rally might occur
BTC has seen nine consecutive down weekly candlesticks with no recovery rallies. Moreover, Bitcoin price has crashed 45% since March 28 and shows no signs of a relief trend. This may indicate that the downswing is overextended and that a minor bounce seems likely.
The CME gap between $34,445 to $35,180 is another reason for expecting a minor run-up. It is said the market abhors a gap and there is a tendency for price to fill them. CME gaps are formed during the weekends when the Chicago Mercantile Exchange closes the trading floor, but the crypto exchanges are open.
A further reason is that the high time frame resistance at $35,000 has not been tagged after its breakdown. Usually, when a support level is flipped into a resistance barrier, a retest of the newly formed blockade adds confirmation to the said flip. Hence, a leg-up that retests the $35,000 resistance level will solidify it as a significant hurdle. Interestingly, the CME gap overlaps with the aforementioned barrier, adding credence to a potential retest that will most likely get rejected.
Lastly, a sudden sell-off during such an optimistic phase would not just catch these market participants off guard but also allow the smart money to get orders filled for a massive crash to the $20,000 psychological level or lower.
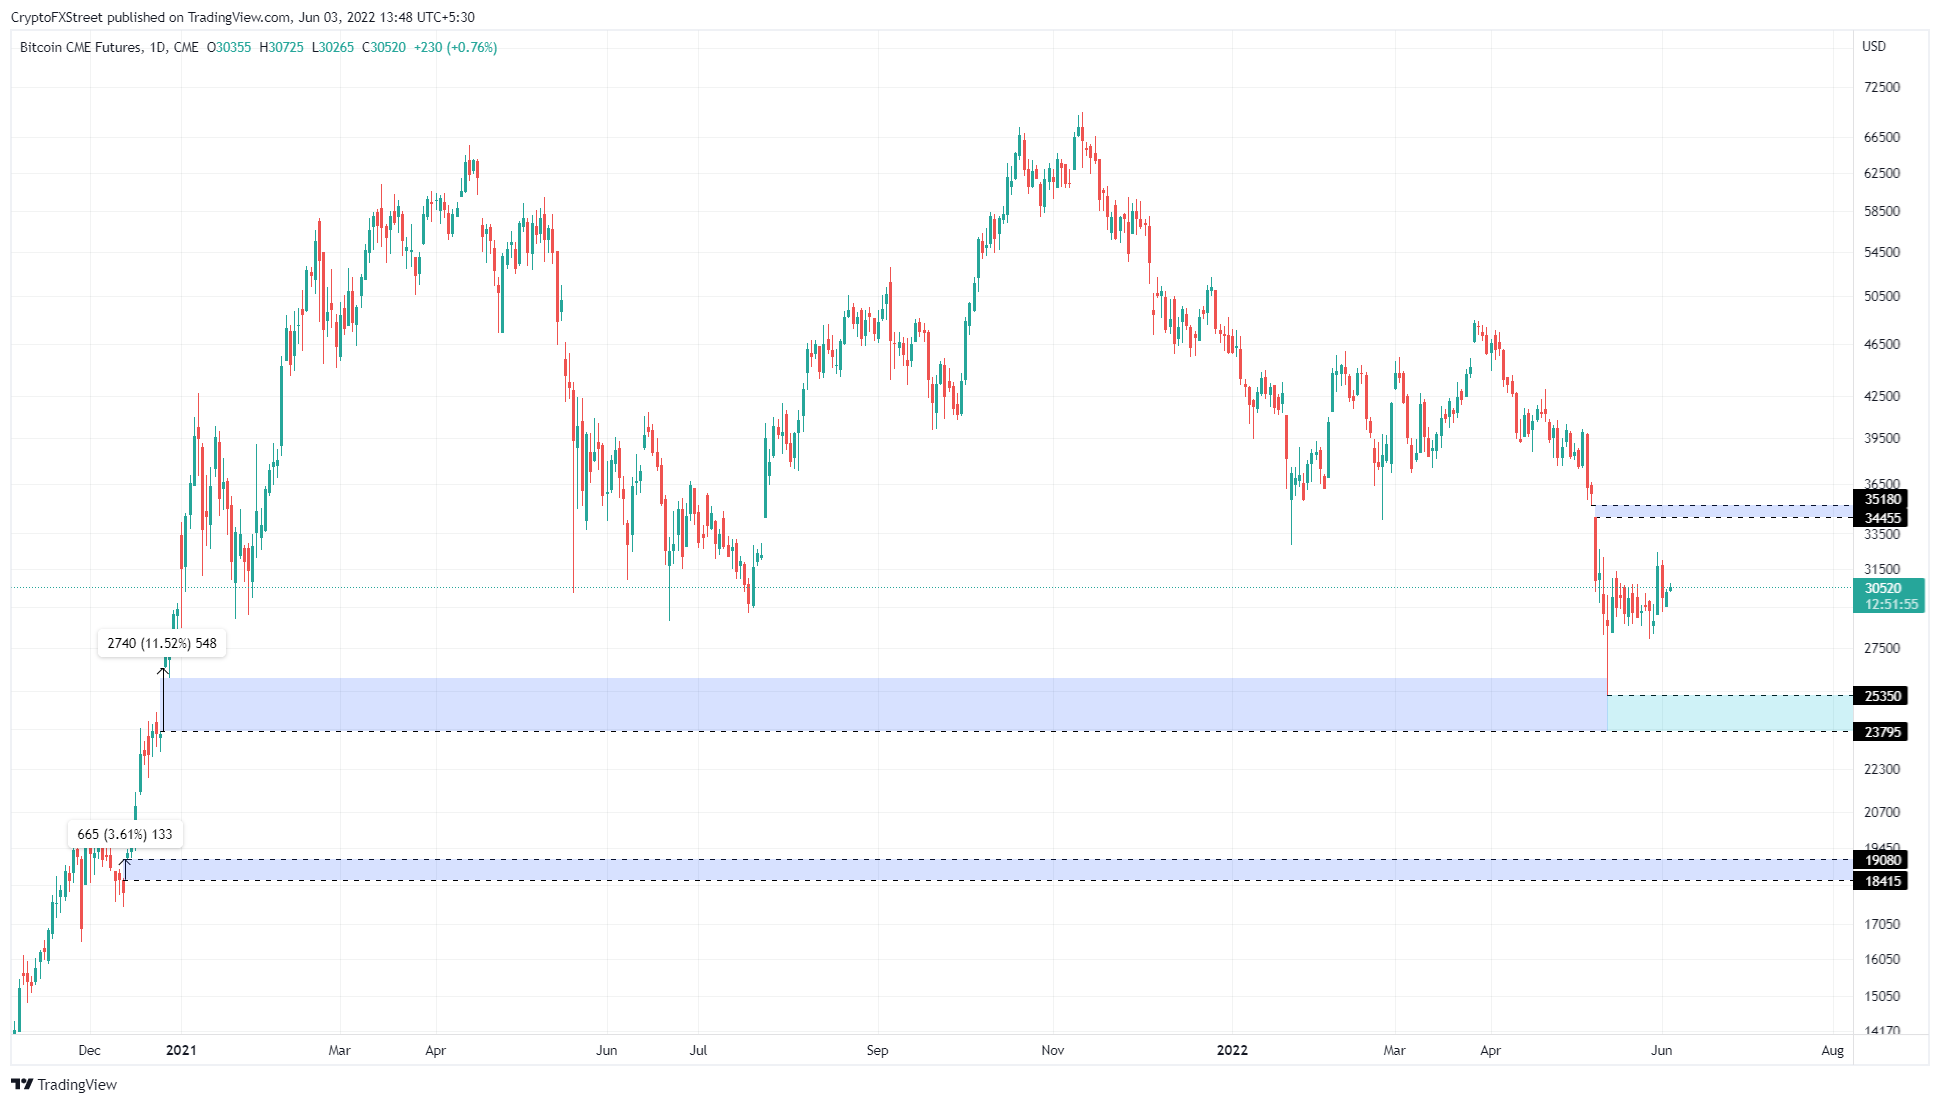
BTC1! 1-day chart
On-chain metrics reveal panicking investors
That said, although a relief rally to $35,000 might seem possible, the bearish macro trend seems to be firmly placed. Both the outlooks explained in this article forecast a similar endgame - a crash to $20,000 or lower.
Supporting this macro bearish trend for Bitcoin price is the net exchange position change. This index tracks the number of BTC flows to exchanges and can serve as an indicator of investor sentiment and can also forecast the chances of a sell-off.
Since May 9, the number of BTC inflows has increased, pushing the netflow to 72,815 as of June 1. Such a level was last seen in the second week of May 2021, when the Bitcoin price was heading toward its then all-time high of $64,854.
Hence, a sell-off could result if these investors start panic selling their holdings, further leading to a capitulation.
-637898430666908061.png)
BTC exchange net position change
While the overall outlook for Bitcoin price seems wildly bearish, things could take a turn in bulls’ favor if certain conditions are met.
The first and foremost requirement is for BTC to produce a higher high on a macro outlook. A daily candlestick close above $53,000 would technically produce a higher high.
The second requirement is for the bulls to produce a higher low relative to the May 12 swing low at $26,700.
If these two conditions are met, things could turn around, allowing sidelined buyers to step in at a higher low and kick-start a bull run for Bitcoin price. In such a case, market participants could expect BTC to climb higher and retest the $60,000 psychological level and perhaps extend higher to revisit the all-time high at $69,000.
Author

Akash Girimath
FXStreet
Akash Girimath is a Mechanical Engineer interested in the chaos of the financial markets. Trying to make sense of this convoluted yet fascinating space, he switched his engineering job to become a crypto reporter and analyst.


