Bitcoin/USD technical analysis

Bitcoin/USD Technical Analysis Summary
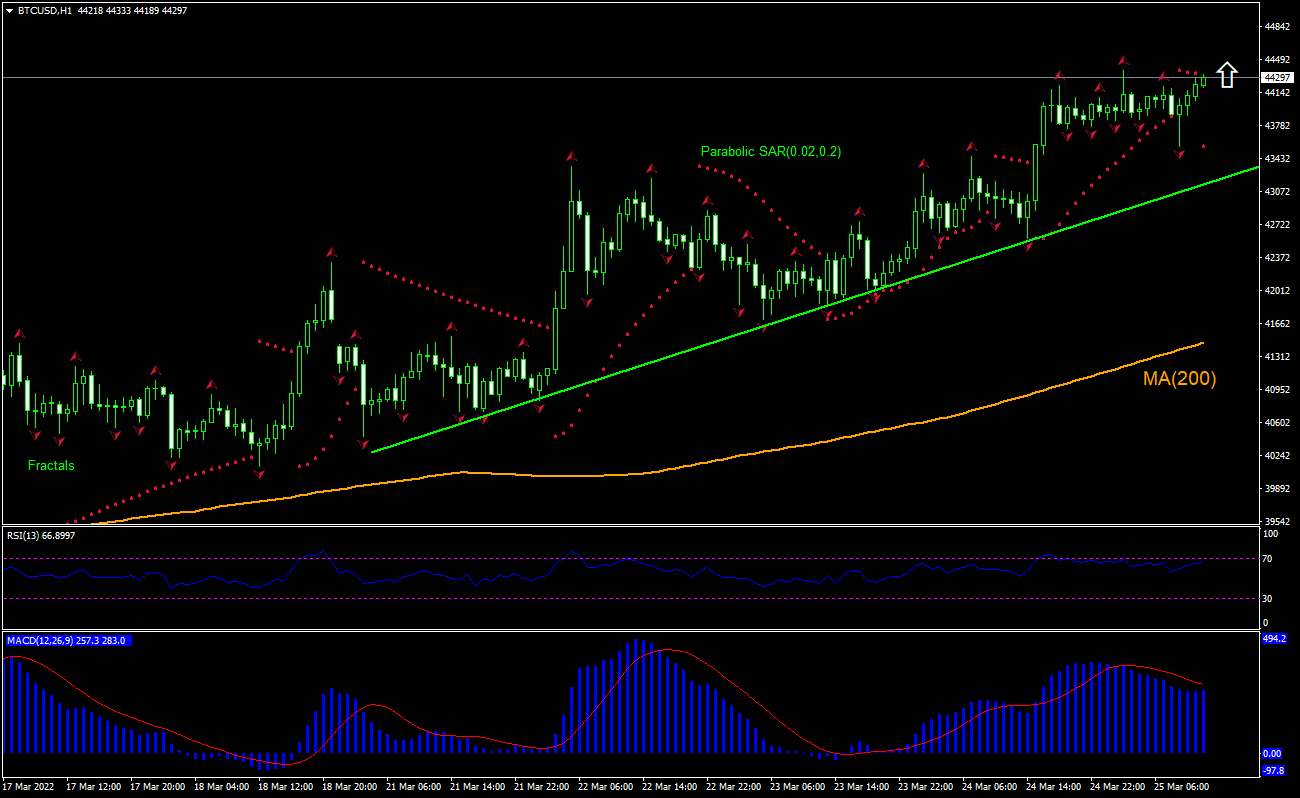
Buy Stop։ Above 44655
Stop Loss: Below 43562
| Indicator | Signal |
| RSI | Neutral |
| MACD | Buy |
| MA(200) | Buy |
| Fractals | Buy |
| Parabolic SAR | Buy |
Bitcoin/USD Chart Analysis
Bitcoin/USD Technical Analysis
The BTCUSD technical analysis of the price chart on 1-hour timeframe shows BTCUSD: H1 is rising above the 200-period moving average MA(200) which is rising while the RSI indicator is approaching the overbought zone. We believe the bullish momentum will continue after the price breaches above 44655. A level above this can be used as an entry point for placing a pending order to buy. The stop loss can be placed below the fractal low at 43562. After placing the order, the stop loss is to be moved to the next fractal low indicator, following Parabolic signals. Thus, we are changing the expected profit/loss ratio to the breakeven point. If the price meets the stop loss level without reaching the order, we recommend cancelling the order: the market has undergone internal changes which were not taken into account.
Fundamental Analysis of CRYPTO - Bitcoin/USD
A member of parliament of Russia mentioned Russia could agree to payments for its natural gas in Bitcoins too. Will the BTCUSD price continue rebounding?
The head of Russia’s Energy Committee at the State the lower house of parliament that Russia could have settlements for gas with countries based upon mutually agreed set of currencies and “if there are bitcoins — we will trade in bitcoins.” Earlier on Wednesday President Vladimir Putin announced that Russia will ask “unfriendly” nations to pay with rubles for the natural gas they buy.
Want to get more free analytics? Open Demo Account now to get daily news and analytical materials.
Author

Dmitry Lukashov
IFC Markets
Dimtry Lukashov is the senior analyst of IFC Markets. He started his professional career in the financial market as a trader interested in stocks and obligations.


