|

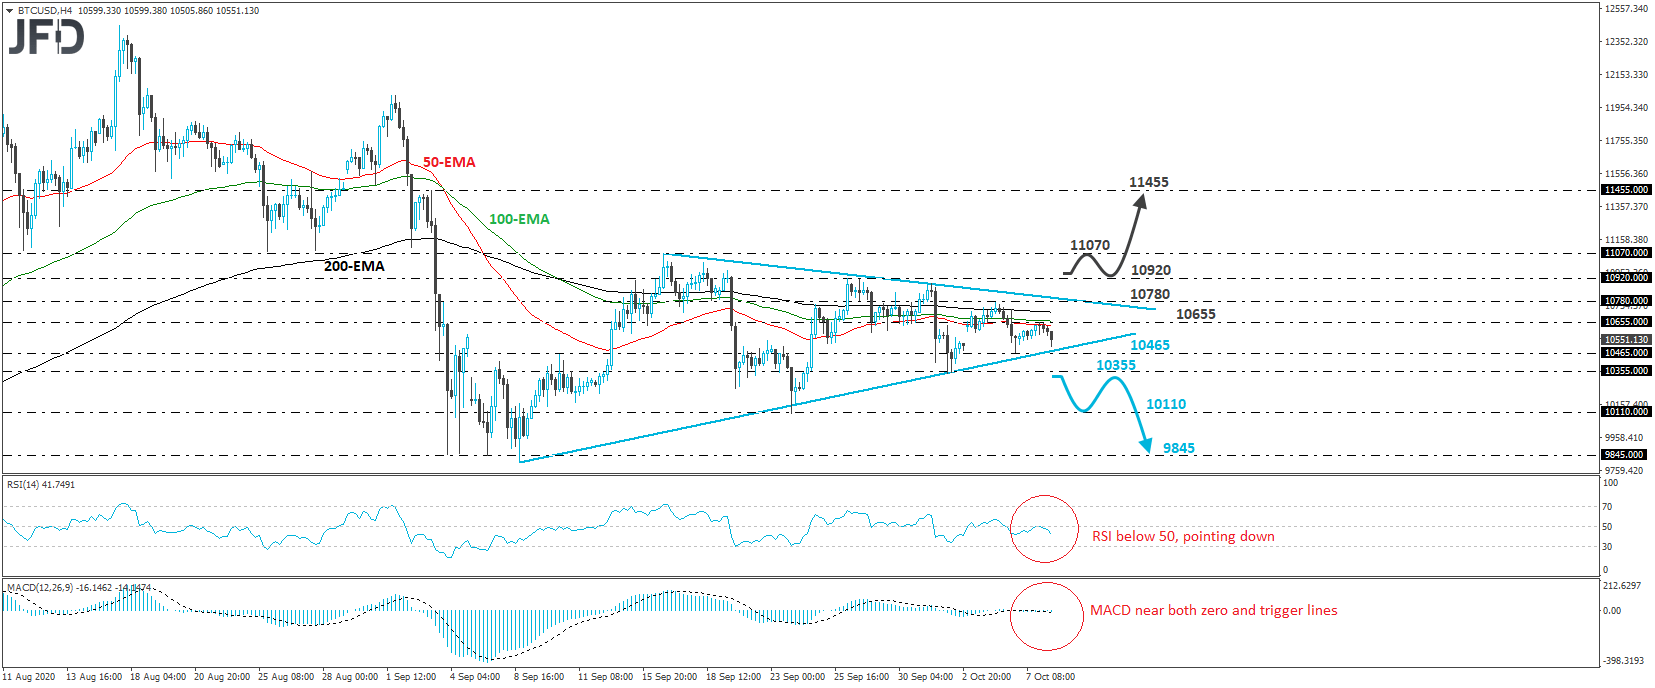
Bitcoin trades within a triangle

BTC/USD traded lower on Thursday, after it hit resistance at 10655 on Wednesday. Overall, the crypto has been trading within a symmetrical triangle formation since September 8th, and thus, despite the price’s proximity to the lower end of the triangle, we will hold a flat stance for now.

We will start examining the bearish case only if we see a clear dip below 10355. Such a move could also confirm the break below the lower end of the triangle and may initially pave the way towards the low of October 2nd, at around 10110. If that barrier is not able to halt the slide, a move lower may see scope for extensions towards the 9845 zone, which provided strong support on September 4th, 7th and 8th.

Turning our gaze to our short-term oscillators, we see that the MACD is flat, running very close to both its zero and trigger lines, something that enhances our choice to stay sidelined until the crypto exits the triangle. That said, the RSI lies below 50 and points down, indicating that there are more chances for a downside exit rather than an upside one.

In order to start considering the upside scenario, we would like to see a strong break above the 10920 resistance zone, marked by the high of September 28th. The next stop could be the peak of September 16th, at 11070, the break of which could carry larger bullish implications, perhaps paving the way towards the high of September 3rd, at 11455.

BTCUSD

JFDBANK.com - One-stop Multi-asset Experience for Trading and Investment Services


Author

More from JFD Team
Share:

Editor's Picks

Ripple technical weakness persists as selling intensifies toward $1.00

Ripple grinds lower, trading around $1.10 at the time of writing on Wednesday. The sticky bearish outlook mirrors the broader crypto market, with major coins such as Bitcoin and Ethereum facing weak demand as investors de-risk.

Crypto Today: Bitcoin, Ethereum, XRP face downside pressure amid investor de-risking

Major crypto assets trade under intense headwinds on Wednesday, as market participants navigate complex geopolitical and macroeconomic environments. Bitcoin has slipped toward $61,000 after its recent rebound was sold near $64,000, leaving buyers exhausted.

Bitcoin Price Forecast: Sticky inflation fears threaten deeper sell-off in BTC

Bitcoin extends its decline on Wednesday, trading below $61,500 at the time of writing as renewed US-Iran tensions keep the risk sentiment capped. In addition, persistent capital outflows from US-listed spot Exchange Traded Funds continue to fuel selling pressure on BTC.

Pi Network extends decline as CEX outflows fail to offset bearish pressure

Pi Network edges lower on Wednesday, extending its third consecutive day of losses. The technical outlook for PI is largely bearish, with a risk of a steeper correction below $0.1184.

Bitcoin: After the bloodbath, everyone looks at $60,000
Bitcoin (BTC) hovers above $62,000 at the time of writing on Friday, weighed down by growing risk-off sentiment due to persistent geopolitical tensions in the Middle East and sticky macroeconomic uncertainty. The institutional sell-off continued to wreak havoc on capital flows, with spot Bitcoin Exchange-Traded Funds (ETFs) recording billions in outflows.