Bitcoin tests 2024 demand as $66,900 becomes the new balance point [Video]
![Bitcoin tests 2024 demand as $66,900 becomes the new balance point [Video]](https://editorial.fxsstatic.com/images/i/BTC-bearish-animal-1_XtraLarge.png)
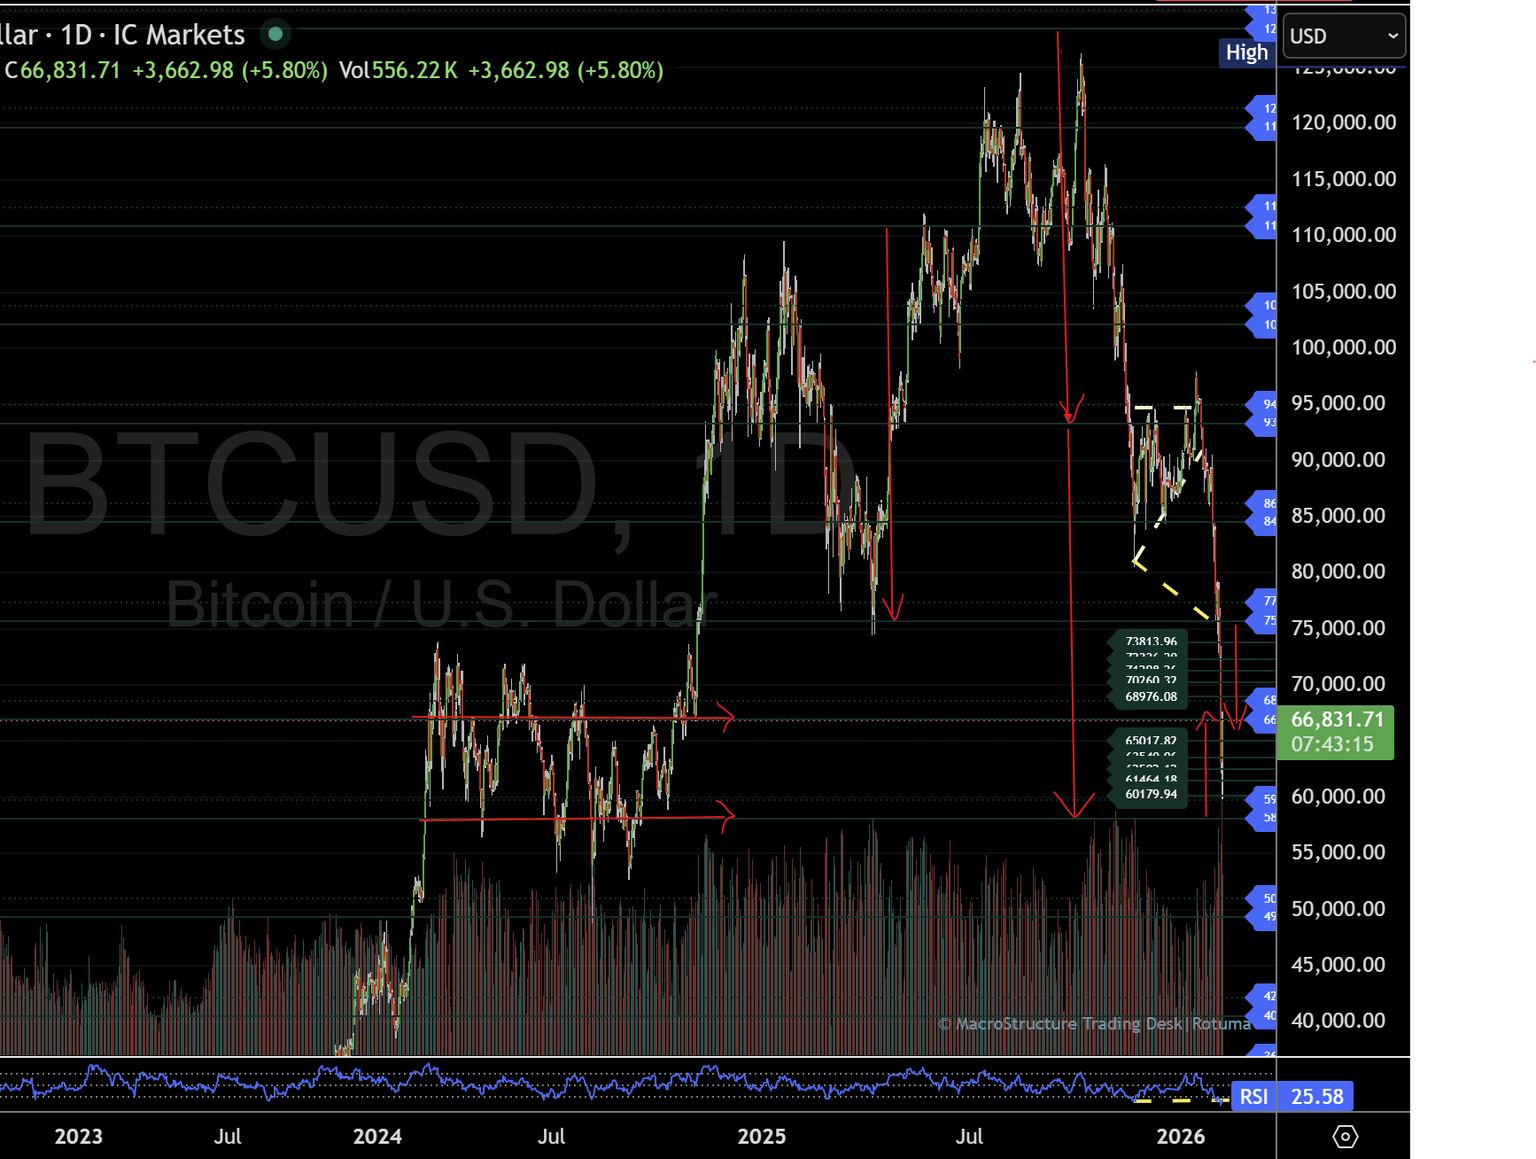
BTC’s structure is unchanged, but the sell-off extended into the ~$59,700 zone—now the market’s next read hinges on whether price can accept above $66,900 and repair into the $68,976–$70,260 band.
Bitcoin Price Forecast: Structure unchanged as BTC tests 2024 demand band
This update is a follow-up to the February 2 desk report. Bitcoin’s broader structure remains intact, but price has extended into a lower phase, forcing a fresh “acceptance vs. rejection” read rather than a story-driven one.
In the previous update, BTC broke below $80,000 and was pressing lower toward $71,000 in search of support. Since then, the pullback extended into the ~$59,700 zone, completing a deeper downside rotation and bringing Bitcoin into a historically responsive demand pocket on the daily chart.
Bitcoin revisits a familiar demand zone
A key development is that BTC is now aligned with the March–October 2024 demand band, the same area that previously acted as the base for a sustained advance that ultimately carried price into the $109,000 region in January 2025. The relevance of this zone is not the history itself—it’s the fact that the market has previously shown it can build value and rotate higher from this region once acceptance develops.
At the same time, the current pullback is starting to resemble the January–April 2025 rotation, where Bitcoin extended sharply lower, then spent time forming a decision corridor before the next directional move emerged. The parallel matters because it reframes the next question: not whether BTC “should” bounce, but whether the market can hold and consolidate long enough to establish a new two-way auction.
The core question: repair higher or consolidate before the next decision?
From here, Bitcoin’s next move can be framed in two clean outcomes:
- Hold and repair: Price holds key balance, rotates higher, and begins rebuilding value back into prior supply.
- Fail and continue lower acceptance: The market rejects balance, rotates lower again, and keeps the lower structure active.
This is why the current map is best treated as a two-way structure until price proves otherwise.
Bitcoin levels that matter: the two-way map after the downside extension
Central pivot: $66,900 (balance point)
The $66,900 area acts as the balance point for the current two-way structure. Acceptance above this pivot is the first condition needed for a repair attempt to develop.
At the time of writing, Bitcoin trades around $67,300, sitting just above the central pivot, which keeps the repair path technically alive—but still unconfirmed.
Upper range: $68,976–$70,260 (repair checkpoint)
If BTC can hold above $66,900 and build acceptance, the first major resistance band sits at:
- $68,976 – $70,260
This zone is the initial “repair checkpoint.” A simple tag into resistance doesn’t change the read. What matters is whether BTC can work above the band and hold—that would suggest the market is transitioning from forced selling into organised trade and rotation.
Lower structure: $65,017–$63,540 (support band)
If BTC fails to hold the pivot and rotates back under balance, the lower structure remains active, with attention shifting to:
- $65,017 – $63,540
This support band is the next area where responsive demand needs to show up to prevent continued value migration lower.
What to watch next: Acceptance tells the story
Bitcoin is currently sitting in a location that can support two-way trade. The next sessions are less about prediction and more about whether price can prove acceptance.
- Acceptance above $66,900: Supports rotation into the $68,976–$70,260 band and maintains the repair narrative.
- Rejection below $66,900: Keeps the auction heavy and places $65,017–$63,540 back in focus.
- Chop at the pivot: Normal for a two-way structure—this is where overtrading tends to happen. The cleaner opportunities typically appear once the market shows acceptance at the edges.
TPO / profile lens (if you’re using it)
The profile read should align with the pivot:
- Acceptance looks like value building above $66,900 (stabilising POC/VA and sustained rotations).
- Rejection looks like brief probes above the pivot that rotate back below and keep value leaning lower.
These desk updates document a structure-first process, observing how price accepts or rejects predefined levels over time. Coverage spans futures, commodities, forex, bonds, crypto, stocks, and indices, with structure providing context before direction. This observation is for informational purposes only and does not constitute financial advice.
Structure defines context; price reveals response.
Author

Denis Joeli Fatiaki
Independent Analyst
Denis Joeli Fatiaki possesses over a decade of extensive experience as a multi-asset trader and Market Strategist.


