Bitcoin: Testing the channel

Following on from my last posting, here is an updated chart of the channel we are using for GBTC.
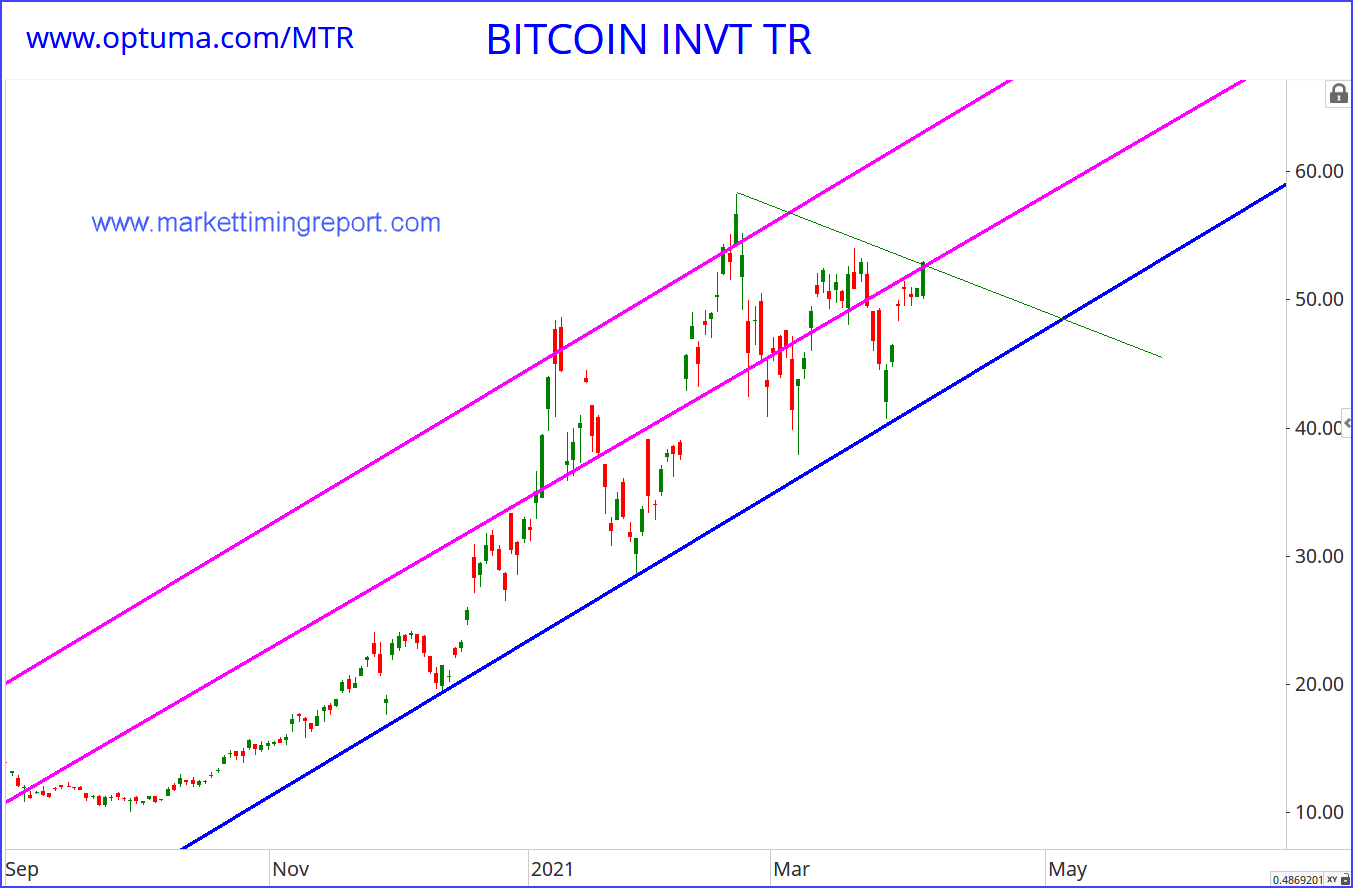
You can see that we are both at the centre channel line (in purple) and also at a trend line point (green).
We are also approaching a time cycle turn point from our system today.
It is possible we me see some technical resistance here especially on the GBTC.
Looking directly at Bitcoin you will see that the histogram system is working incredibly well on crypto.
Scanning ahead, ther is a significant turn point on the radar within a few days.
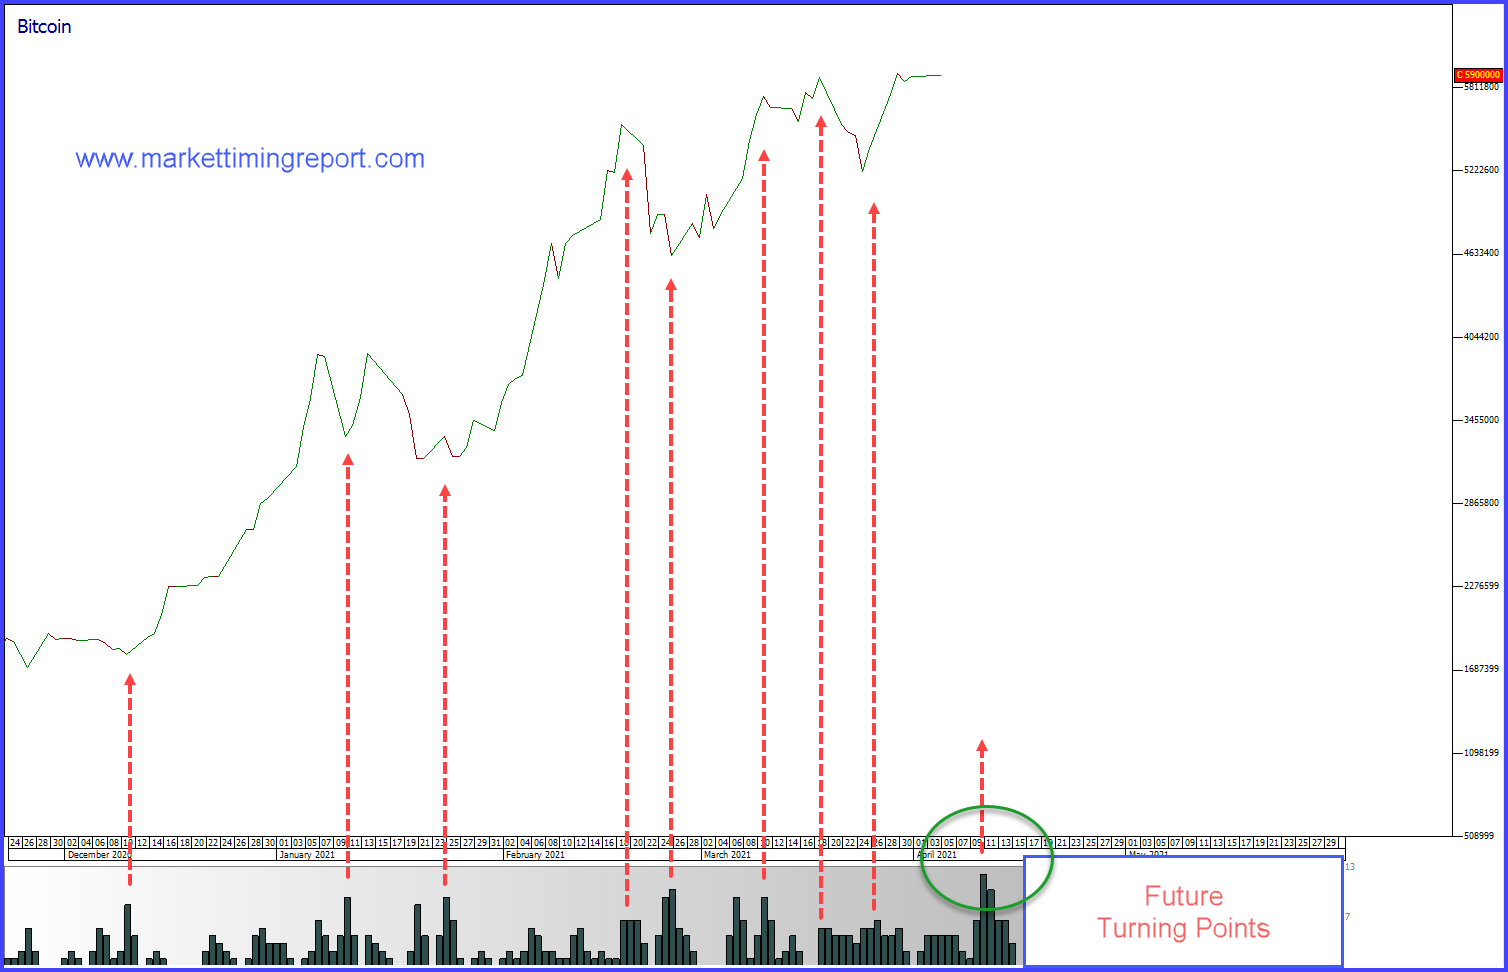
The histogram spikes below the chart are known in advance.
Therefore they are predictive.
Note how the spikes align with reversals.
Note that we are only days away from the largest spike of recent times.
This is circled in green.
Expect a reversal then.
As long as the channel in the first chart is not broken, then the trend remains up.
Author

Andrew Pancholi
Market Timing Report
Andrew Pancholi is a world-renowned trading expert specializing in market timing.


