Bitcoin Technical Analysis: BTC/USD subject to a potential explosive move out from descending daily wedge
- Bitcoin price nursing minor losses on Thursday of just 1.6% in the second half.
- Price action is moving within a descending wedge pattern, subject to a possible breakout.

Spot rate: 3840.62
Relative change: -1.65%
High: 3892.45
Low: 3816.04
Trend: Bearish
Support 1: 3803.17, daily pivot point support.
Support 2: 3717.34, daily pivot point support.
Support 3: 3661.2, daily pivot point support.
Resistance 1: 3945.14, daily pivot point resistance.
Resistance 2: 4001.28, daily pivot point resistance.
Resistance 3: 4087.12, daily pivot point resistance.
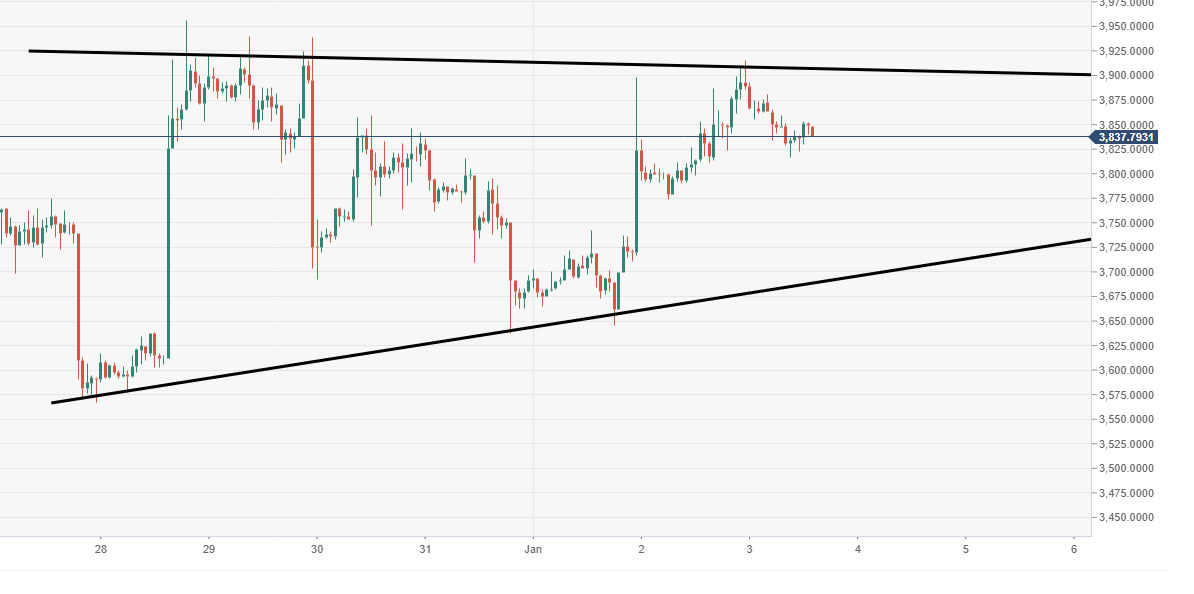
BTC/USD 60-minute chart
- Price is moving within a horizontal wedge pattern, demonstrating the frustrating mundane trading range.
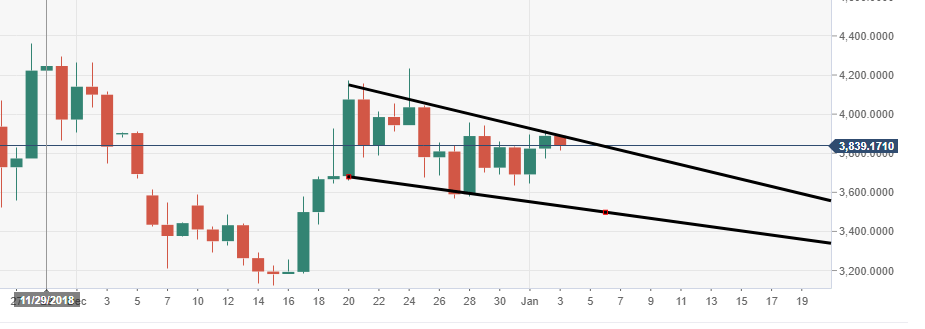
BTC/USD daily chart
- BTC/USD is falling within a descending wedge pattern, could be subject to a breakout to the upside.
Author

Ken Chigbo
Independent Analyst
Ken has over 8 years exposure to the financial markets. He started his career as an analyst, covering a variety of asset classes; forex, fixed income, commodities and equities.


