Bitcoin Technical Analysis: BTC/USD reloading for another wave of bullish momentum, after shooting 7% higher
- Bitcoin price on Tuesday was seen holding decent gains of over 3% in the session.
- BTC/USD had jumped to the north in early hours, on the back of last night reports that Nasdaq will list Bitcoin futures from next year.
- Price action has formed a bullish pennant pattern, as seen via the 15-minute chart view, subject to an extended breakout.

BTC/USD 15-minute chart
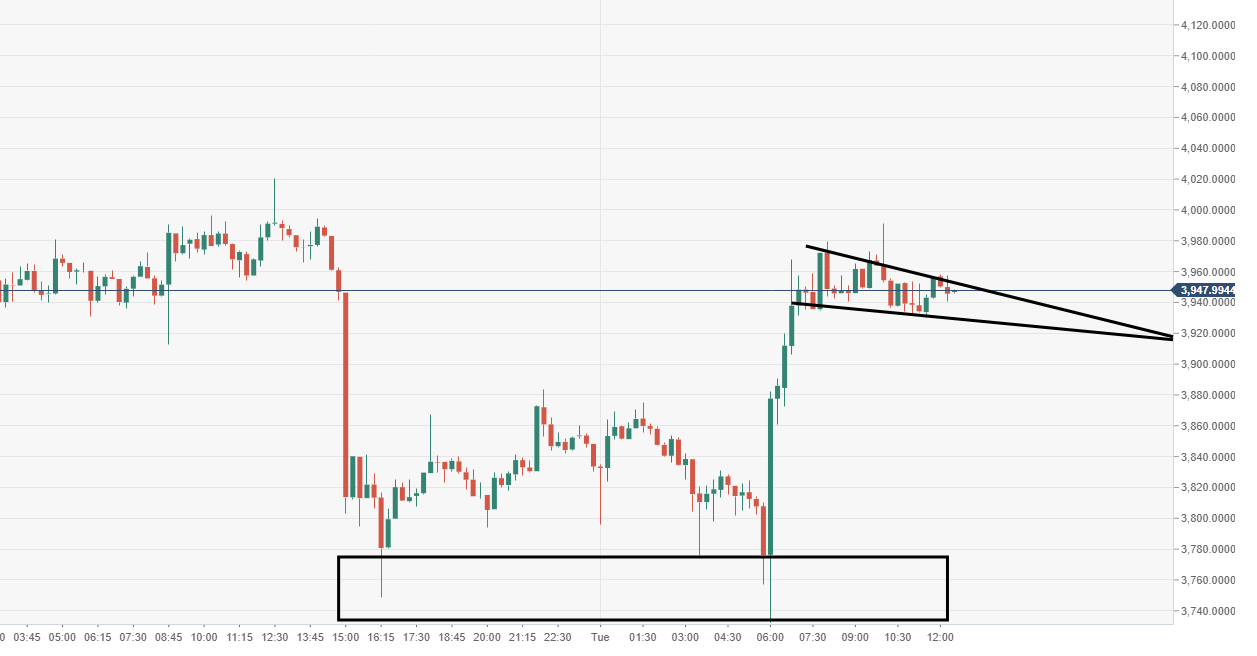
Spot rate: 3942.52
Relative change: -5.52%
High: 3990.88
Low: 3735.35
Trend: Bullish
Support 1: 3930.56, lower part of pennant pattern.
Support 2: 3683.36, daily pivot point support.
Support 3: 3533.13, daily pivot point support.
Resistance 1: 3958.45, upper part of pennant.
Resistance 2: 4049.02, daily pivot point resistance.
Resistance 3: 4264.44, daily pivot point resistance.
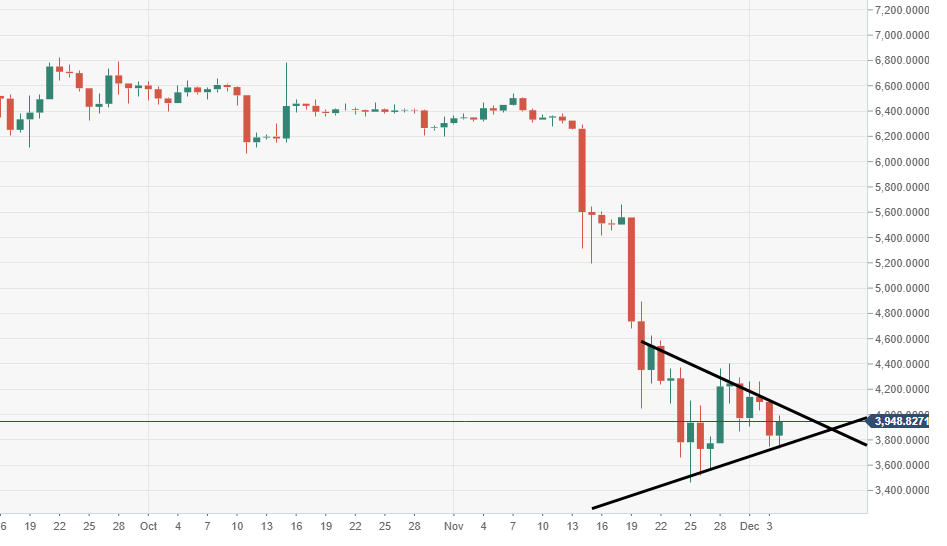
BTC/USD daily chart
- Price action via the daily chart view, is still moving within a bearish pennant set up. bulls must breakout of this, or be punished.
Author

Ken Chigbo
Independent Analyst
Ken has over 8 years exposure to the financial markets. He started his career as an analyst, covering a variety of asset classes; forex, fixed income, commodities and equities.


