Bitcoin Technical Analysis: BTC/USD leaps over 5% higher in just an hour, breaking out from flag pattern
- Bitcoin price is within recovery mode, following the heavy selling pressure seen the prior to the weekend on Friday.
- BTC/USD leaps over 5% in just an hour, after a bull flag patter was seen on the 60-minute time frame.

BTC/USD 60-minute chart
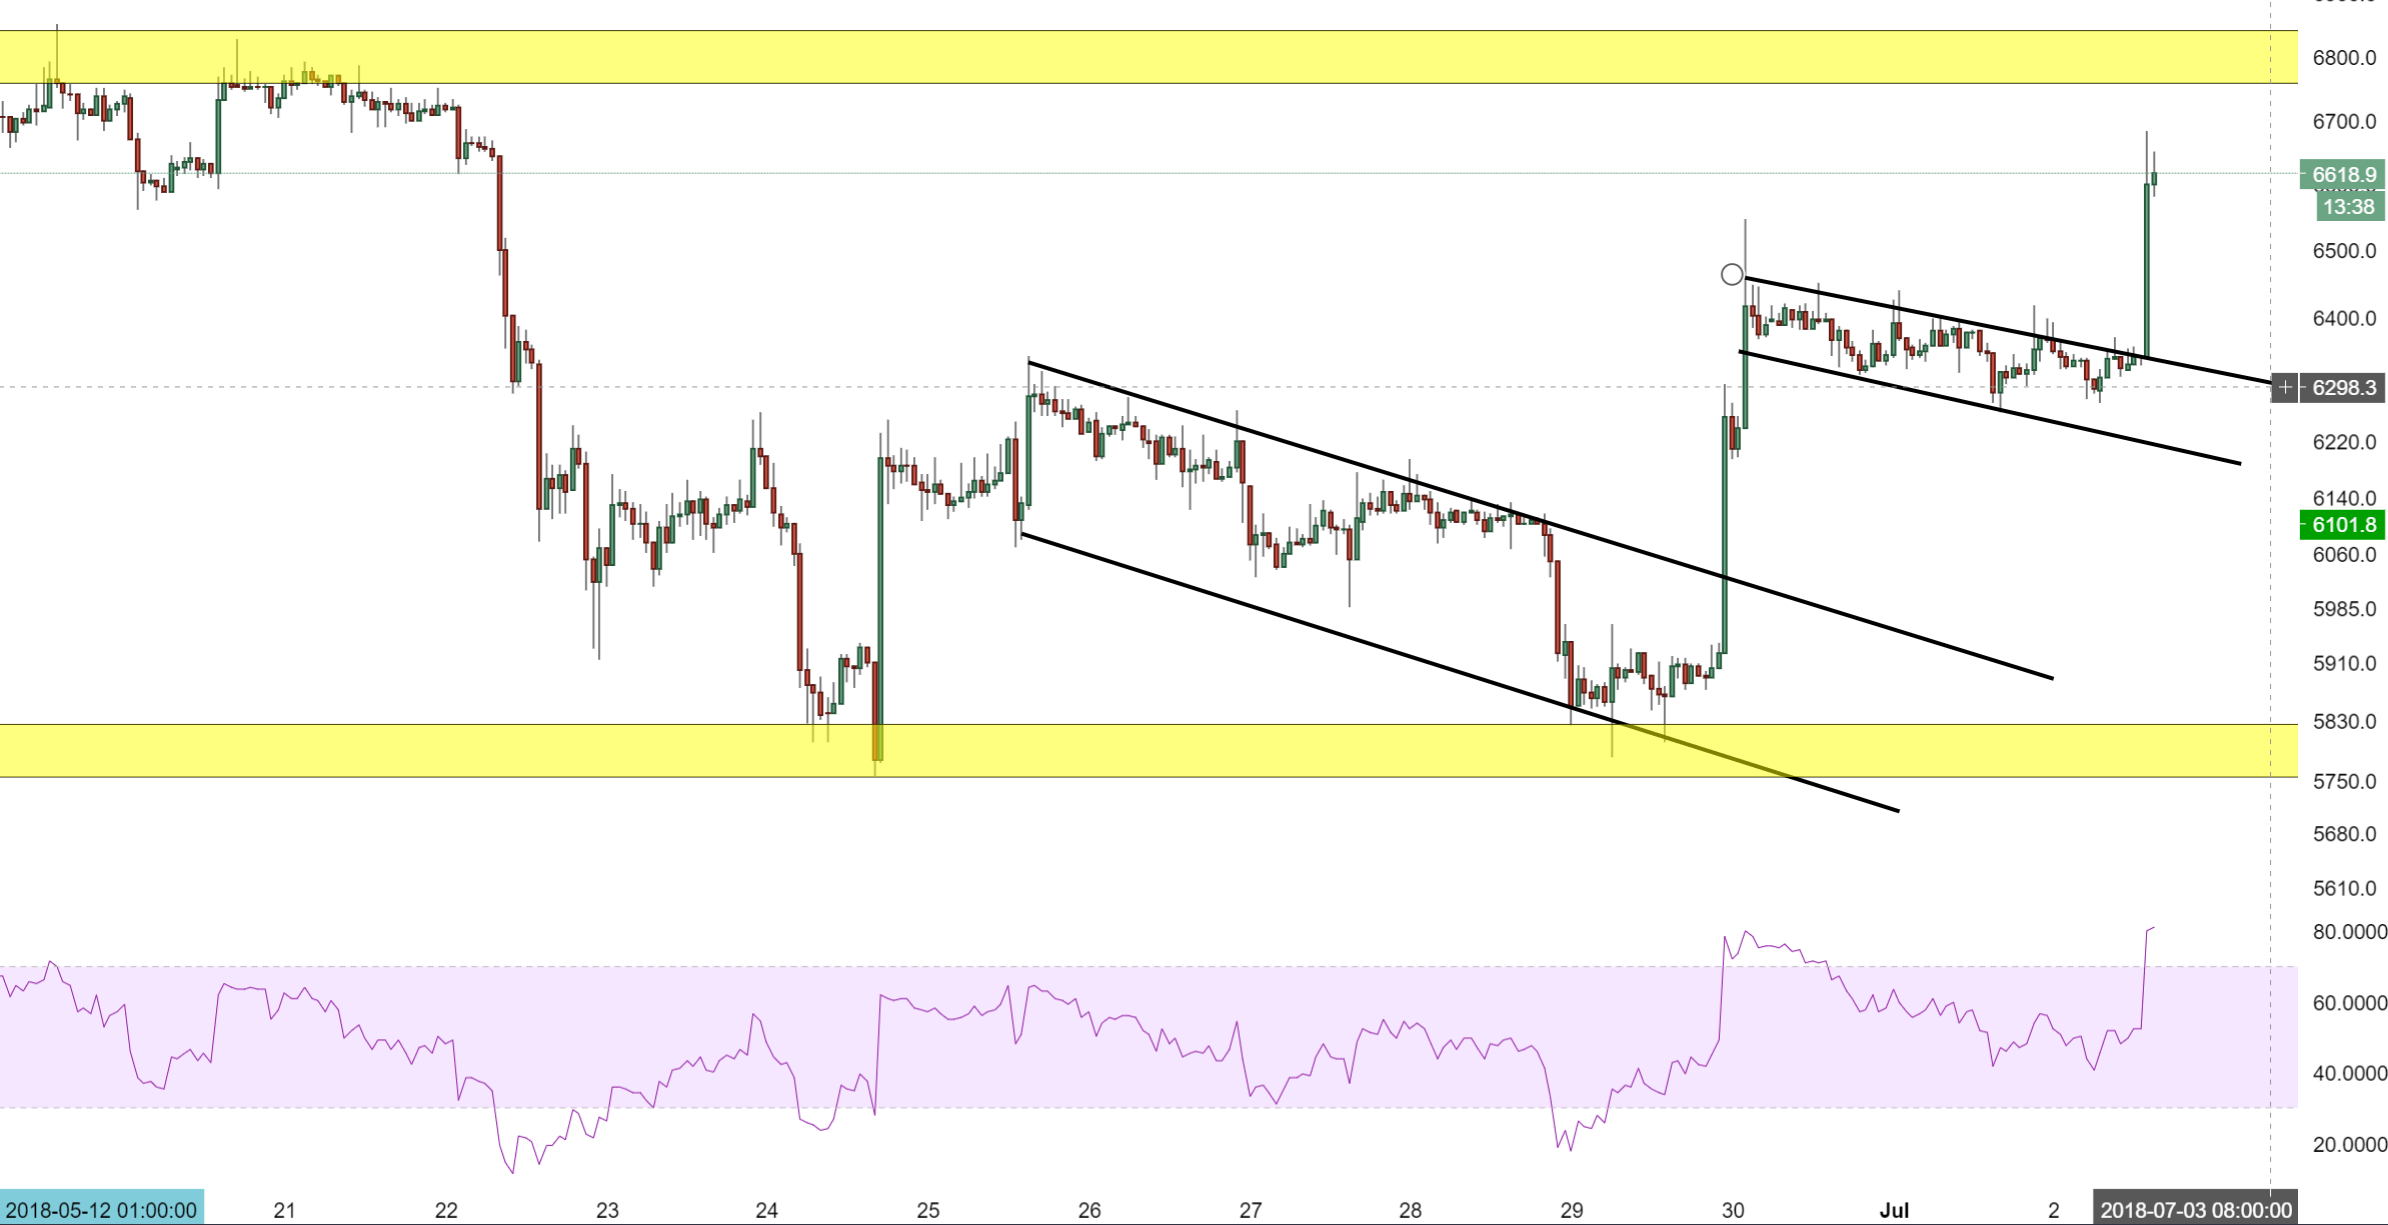
Spot rate: 6602.7
Relative change: +3.98%
High: 6681.1
Low: 6275.0
Trend: Bullish
Support 1: 6500.0, psychological support.
Support 2: 6340.0, above broken bull flag.
Support 3: 6225.6, lower part of bull flag.
Resistance 1: 6761.50, entrance of supply zone.
Resistance 2: 6828.1, 20th June high.
Resistance 3: 6900.0, (resistance on 60-minute chart).
Author

Ken Chigbo
Independent Analyst
Ken has over 8 years exposure to the financial markets. He started his career as an analyst, covering a variety of asset classes; forex, fixed income, commodities and equities.


