Bitcoin Technical Analysis: BTC/USD given consolation chance to run back up to $6000
- Bitcoin price late on Thursday, was seen down over 3.5%, having recovered some of the beating.
- BTC/USD bulls managed to push the price out of a falling channel pattern.
- Given above pattern development, it leaves room for the bulls to recover potentially back towards $6000.

BTC/USD 60-minute chart
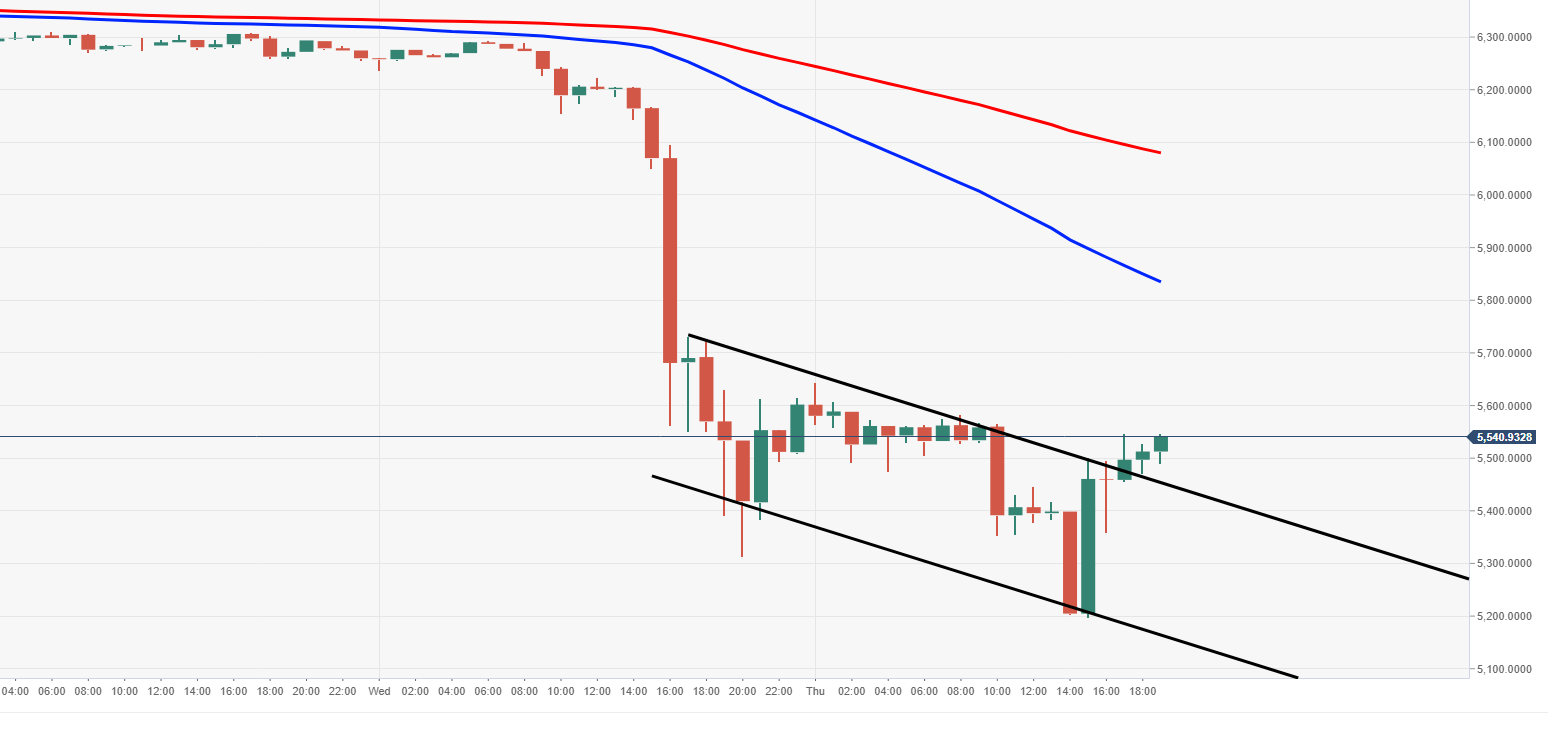
Spot rate: 5543.50
Relative change: -3.68%
High: 5642.74
Low: 5198.30
Trend: Bearish
Support 1: 5178.04, daily pivot point support.
Support 2: 4754.31, daily pivot point support.
Support 3: 4196.29, daily pivot point support.
Resistance 1: 6272.10, underneath breached pennant.
Resistance 2: 6381.28, 50DMA.
Resistance 3: 6484.43, 100DMA.
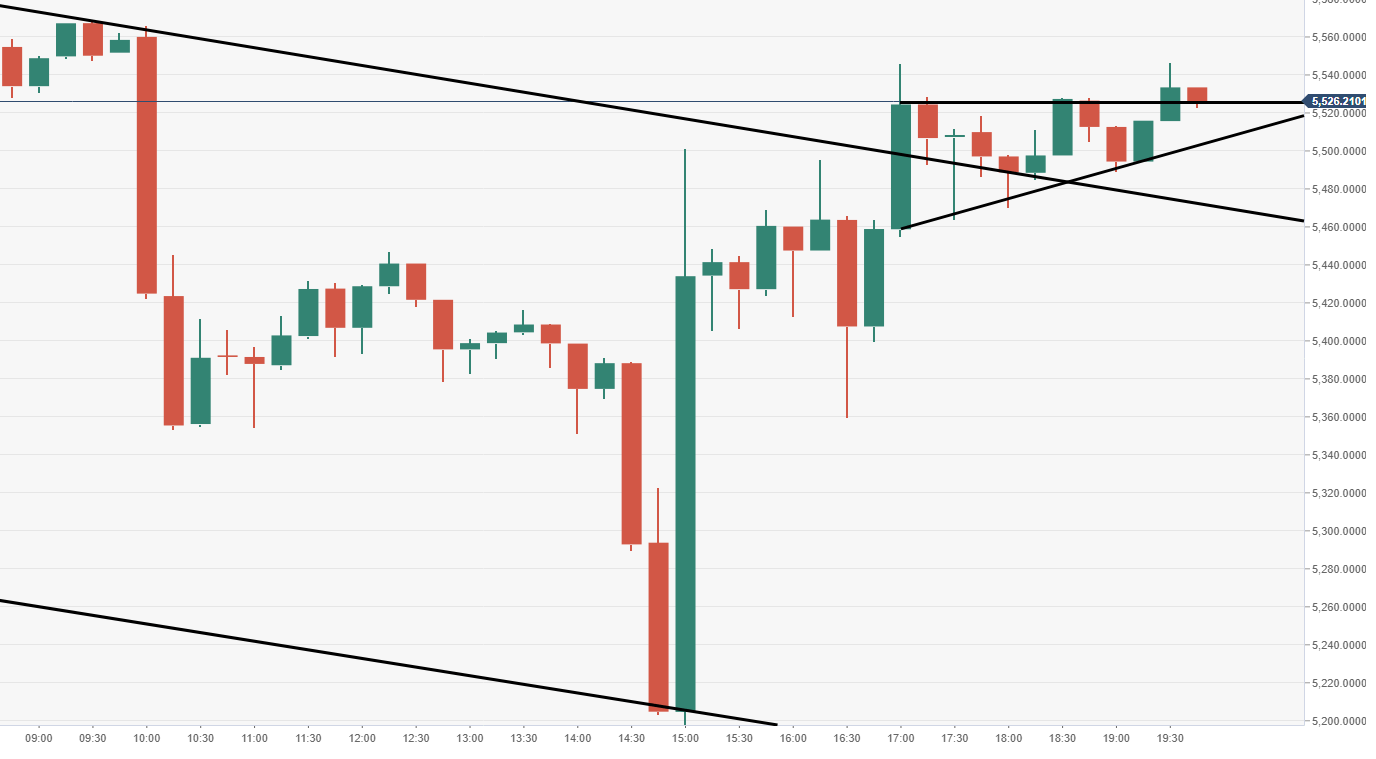
BTC/USD 15-minute chart
- With the recent upside observed in attempt of recovery by the bulls, a pennant pattern has formed, which is subject to another potential breakout higher. As explained above, eyes on $6000.
Author

Ken Chigbo
Independent Analyst
Ken has over 8 years exposure to the financial markets. He started his career as an analyst, covering a variety of asset classes; forex, fixed income, commodities and equities.


