Bitcoin Technical Analysis: BTC/USD dooms day, bears rushing towards $5000
- Bitcoin price slaughtered on Thursday, nursing losses over 7% in the second half of the session.
- BTC/USD bears extend their pressure to the downside, after a firm escape and close below pennant pattern.
- Bears are gunning for the next major psychological mark $5000, not much support seen prior.

BTC/USD daily chart
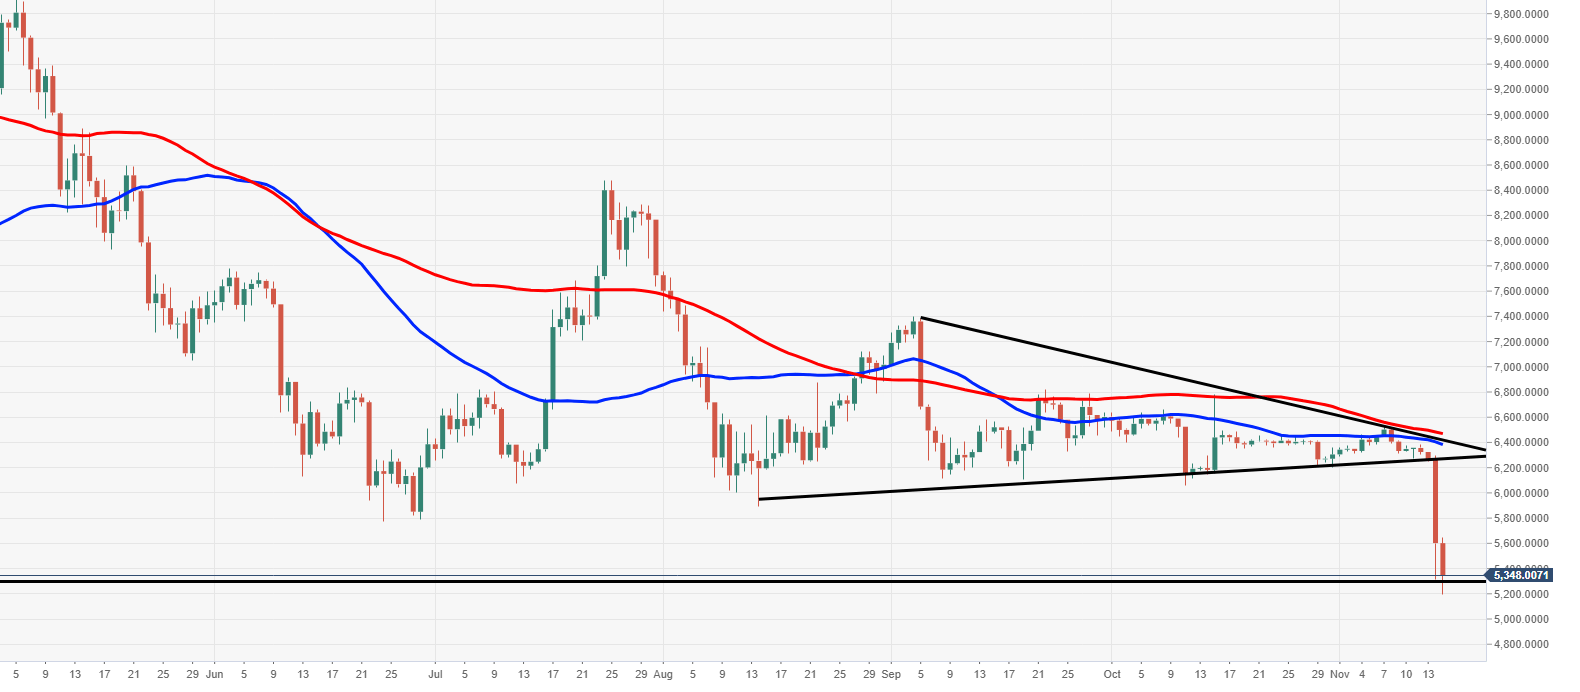
Spot rate: 5237.7
Relative change: -7.47%
High: 5642.74
Low: 5198.30
Trend: Bearish
Support 1: 5178.04, daily pivot point support.
Support 2: 4754.31, daily pivot point support.
Support 3: 4196.29, daily pivot point support.
Resistance 1: 6272.10, underneath breached pennant.
Resistance 2: 6381.28, 50DMA.
Resistance 3: 6484.43, 100DMA.
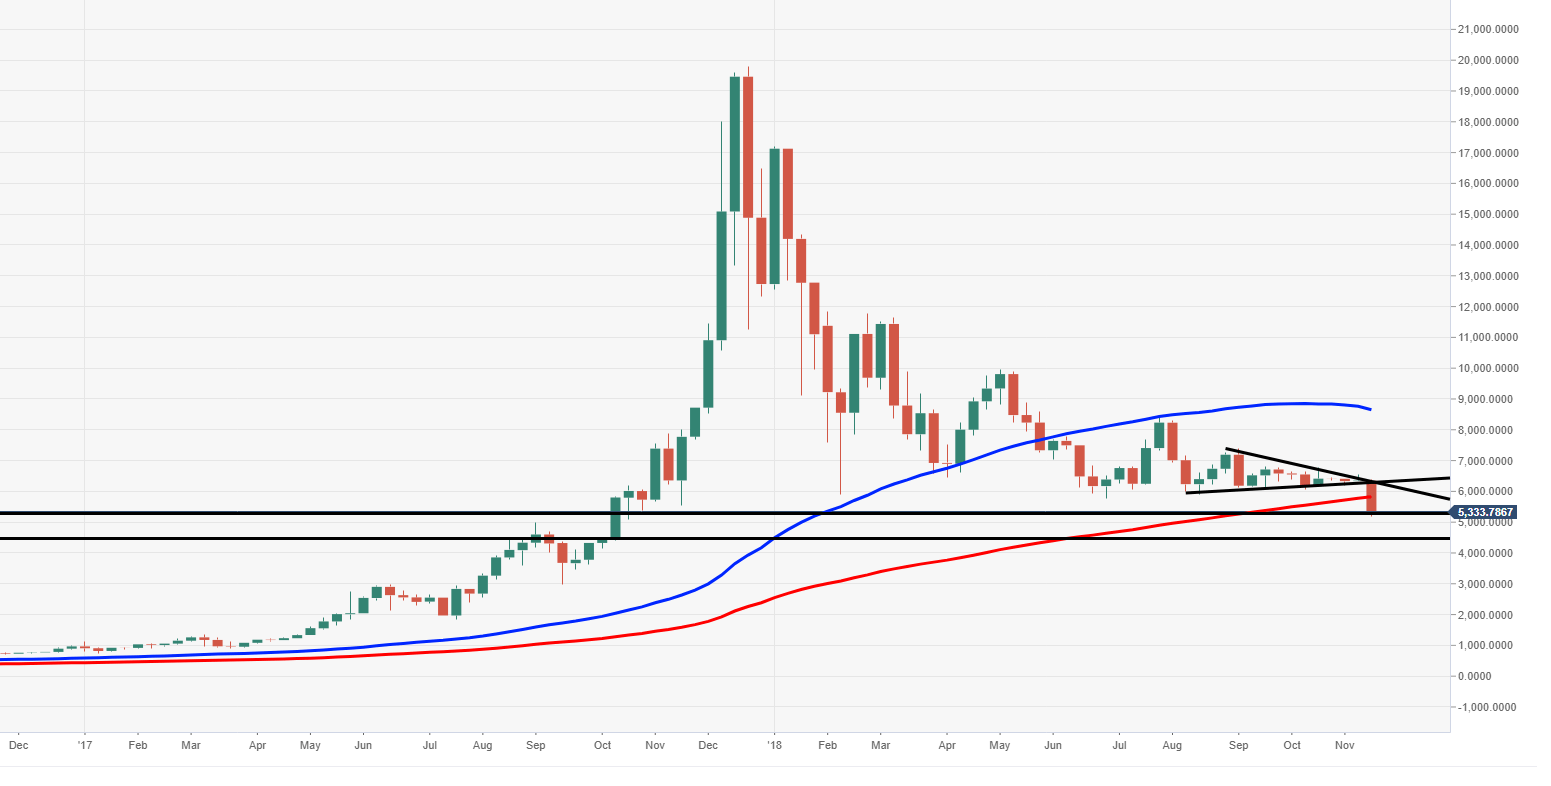
BTC/USD weekly chart
- Weekly chart looks very worrying, next major support should a further breakout occur, would be $4500.
Author

Ken Chigbo
Independent Analyst
Ken has over 8 years exposure to the financial markets. He started his career as an analyst, covering a variety of asset classes; forex, fixed income, commodities and equities.


